
MATLAB: An Introduction with Applications
6th Edition
ISBN: 9781119256830
Author: Amos Gilat
Publisher: John Wiley & Sons Inc
expand_more
expand_more
format_list_bulleted
Related questions
Question
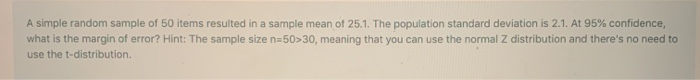

Transcribed Image Text:A simple random sample of 50 items resulted in a sample mean of 25.1. The population standard deviation is 2.1. At 95% confidence,
what is the margin of error? Hint: The sample size n=50>30, meaning that you can use the normal Z distribution and there's no need to
use the t-distribution.
Expert Solution
This question has been solved!
Explore an expertly crafted, step-by-step solution for a thorough understanding of key concepts.

This is a popular solution

Trending nowThis is a popular solution!

Step by stepSolved in 4 steps with 6 images

Knowledge Booster

Similar questions
- A normal distribution has a mean of μ =72 and a standard deviation of σ = 8. What is the probability of selecting a sample of n = 4 scores with a mean less than M = 72?arrow_forwardA recent study done on college students found that the mean time they spend on homework assignments per week is 6.5 hours with a standard deviation of 1.2 hours. Suppose a random sample of 50 college students is taken. Describe the sampling distribution of the sample mean. O shape: exactly normal Hz = 6.5 oz = 1.2 O shape: exactly normal HE= 6.5 oz =0.17 O shape: approximately normal H2 = 6.5 Oz = 0.17 O shape: approximately normal Hz = 6.5 0z = 1.2arrow_forwardThe overhead reach distances of adult females are normally distributed with a mean of 200 cm and a standard deviation of 8 cm. Find the probability that an individual distance is greater than 210.00 cm. Find the probability that the mean for 20 randomly selected distances is greater than 198.50 cm. c. Why can the normal distribution be used in part (b), even though the sample size does notarrow_forward
- An investigator polls a representative sample of common cold sufferers, asking them to estimate the number of hours of physical discomfort caused by their most recent cold. Their estimates approximate a normal curve with a mean of 91 hours and a standard deviation of 23 hours. Show your z-score and p-value calculations. Inverse Normal Distribution: What is the estimated number of hours for the shortest-suffering 20 percent? Inverse Normal Distribution: A medical researcher wishes to concentrate on the 10 percent who suffered the most. To be included in this group, a patient would have suffered how many hours?arrow_forwardA biologist interested in estimating the correlation between the body mass ( in grams) and body length ( in cm) of porcupines has a random sample of 18 porcupines with r = 0.407. The bootstrap distribution she constructed in approximately normal and the standard error is estimated to be 0.165. use the normal distribution to construct and interpret a 98% confidence interval for the correlation between body mass and body length in porcupines. round all values to three decimal places.arrow_forwardA normal distribution has mean 55.955.9 and standard deviation 2.582.58. Find the data value corresponding to z equals negative 3.91z=−3.91. The data value is enter your response here. (Round to the nearest tenth as needed.)arrow_forward
- A doctor tests a claim that an average adult above 50 consumes no more than 3-1/2 pills per day. Standard Dev is 0.7. A sample of 45 adults avg 3.72 per day. Test the claim. -Standard Dev of sample mean -Z-score for sample mean -P-Valuearrow_forwardA hospital administrator believes that the standard deviation of the number of people using outpatient survey per day is greater than 8. A random sample of 15 days is selected. The data are shown below. At α = 0.1, is there enough evidence to support the administrator’s claim? Show your work and indicate the conclusion and assume that the variable is normally distributed.25, 30, 5, 15, 18, 42, 16, 9, 10, 12, 12, 38, 8, 14, 27.arrow_forwardThe overhead reach distances of adult females are normally distributed with a mean of 202.5 cm and a standard deviation of 8 cm A. Find the probability that an individual distance is greater than 212.50 cm b. Find the probability that the mean for 25 randomly selected distance is greater than 201.20 C. why can a normal distribution be used in part b even though the sample size does not exceed 30?arrow_forward
- The grade point average for ALL juniors at a large college has a standard deviation of 0.50. A random sample of 20 students is to be used to estimate the population mean grade point average. What condition do you need to verify prior to computing the probability of obtaining a sample mean within plus or minus 0.2 of the population mean?arrow_forwardAssume all populations are normally distributed. A travel analyst claims that the mean price of a round trip flight from New York City to Los Angeles is less than $507. In a random sample of 55 round trip flights from NYC to LA, the mean price is $502. Assume the population standard deviation is $111. At α = 0.05, is there enough evidence to support the travel analyst’s claim?arrow_forwardA normal distribution with a mean of 25 and a standard deviation of 5. What is the corresponding z score for a case having a value of 10?arrow_forward
arrow_back_ios
arrow_forward_ios
Recommended textbooks for you
- MATLAB: An Introduction with ApplicationsStatisticsISBN:9781119256830Author:Amos GilatPublisher:John Wiley & Sons Inc
 Probability and Statistics for Engineering and th...StatisticsISBN:9781305251809Author:Jay L. DevorePublisher:Cengage Learning
 Statistics for The Behavioral Sciences (MindTap C...StatisticsISBN:9781305504912Author:Frederick J Gravetter, Larry B. WallnauPublisher:Cengage Learning
  Elementary Statistics: Picturing the World (7th E...StatisticsISBN:9780134683416Author:Ron Larson, Betsy FarberPublisher:PEARSON
 The Basic Practice of StatisticsStatisticsISBN:9781319042578Author:David S. Moore, William I. Notz, Michael A. FlignerPublisher:W. H. Freeman
 Introduction to the Practice of StatisticsStatisticsISBN:9781319013387Author:David S. Moore, George P. McCabe, Bruce A. CraigPublisher:W. H. Freeman
MATLAB: An Introduction with Applications
Statistics
ISBN:9781119256830
Author:Amos Gilat
Publisher:John Wiley & Sons Inc
Probability and Statistics for Engineering and th...
Statistics
ISBN:9781305251809
Author:Jay L. Devore
Publisher:Cengage Learning
Statistics for The Behavioral Sciences (MindTap C...
Statistics
ISBN:9781305504912
Author:Frederick J Gravetter, Larry B. Wallnau
Publisher:Cengage Learning
Elementary Statistics: Picturing the World (7th E...
Statistics
ISBN:9780134683416
Author:Ron Larson, Betsy Farber
Publisher:PEARSON
The Basic Practice of Statistics
Statistics
ISBN:9781319042578
Author:David S. Moore, William I. Notz, Michael A. Fligner
Publisher:W. H. Freeman
Introduction to the Practice of Statistics
Statistics
ISBN:9781319013387
Author:David S. Moore, George P. McCabe, Bruce A. Craig
Publisher:W. H. Freeman