MATLAB: An Introduction with Applications
6th Edition
ISBN: 9781119256830
Author: Amos Gilat
Publisher: John Wiley & Sons Inc
expand_more
expand_more
format_list_bulleted
Concept explainers
Question
A simple random sample from a population with a
Expert Solution
arrow_forward
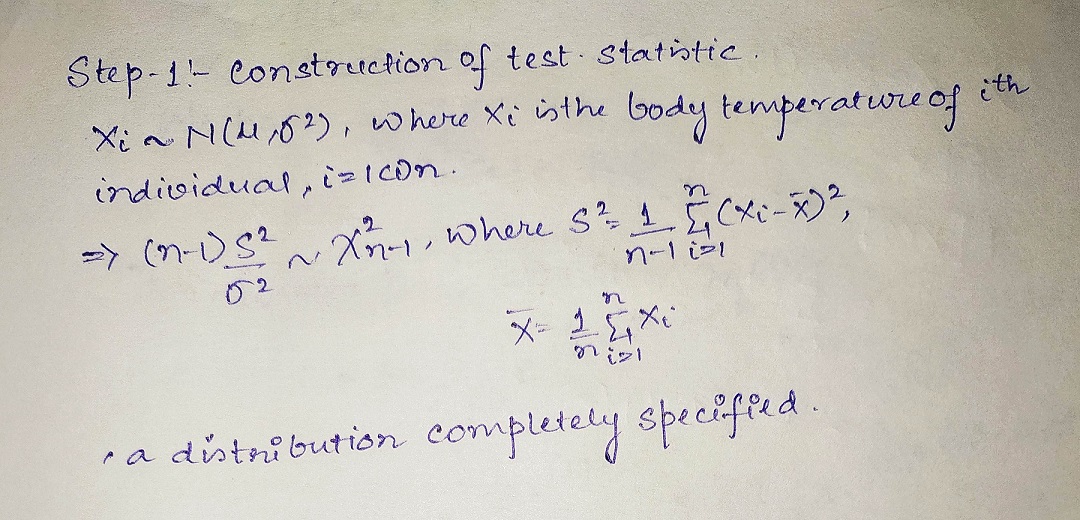
Step 1

arrow_forward
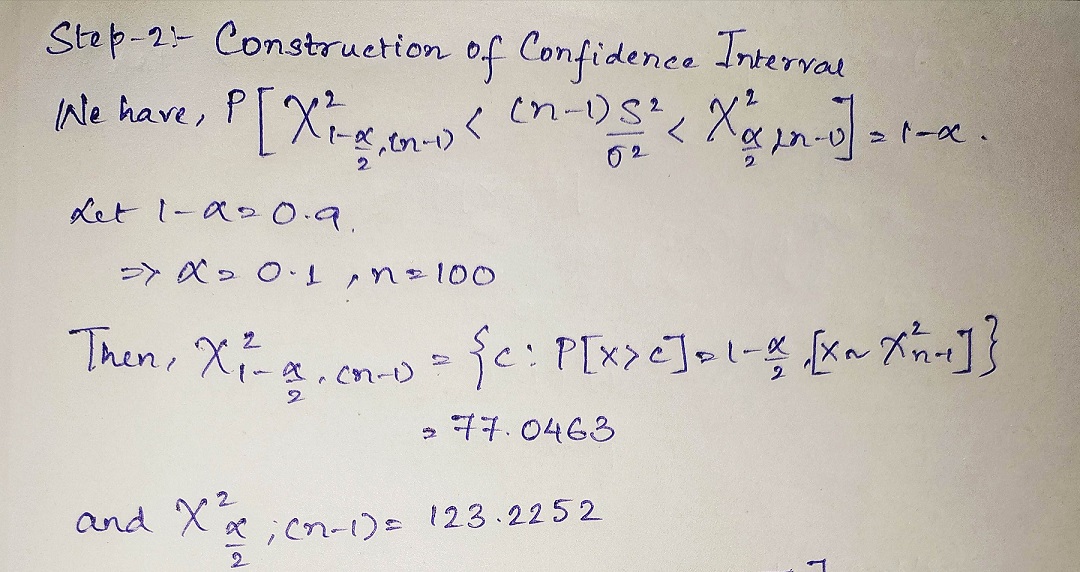
Step 2

Trending nowThis is a popular solution!
Step by stepSolved in 3 steps with 3 images

Knowledge Booster
Learn more about
Need a deep-dive on the concept behind this application? Look no further. Learn more about this topic, statistics and related others by exploring similar questions and additional content below.Similar questions
- A study showed that females’ body temperatures are approximately normally distributed with a mean of 98.40F, and a population standard deviation of 0.700F. Find the female body temperature at the 90th percentile.arrow_forwardMany people believe that the average number of Facebook friends is 328. The population standard deviation is 32.2. A random sample of 60 high school students in a particular county revealed that the average number of Facebook friends was 340. At α = 0.05, is there sufficient evidence to conclude that the mean number of friends is greater than 328?arrow_forwardDeer mice (Peromyscus maniculatus) are small rodents native to North America. Their adult body lengths (excluding tail) are known to vary approximately Normally, with mean μ = 86 millimeters (mm) and standard deviation o = 8 mm.¹ Deer mice are found in diverse habitats and exhibit different adaptations to their environment. A random sample of 14 deer mice in a rich forest habitat gives an average body length of x = 91.1 mm. Assume that the standard deviation of all deer mice in this area is also 8 mm. The output from the TI-83 graphing calculator for a 95% confidence interval based on these findings is given. ZInterval (86.909, 95.291)arrow_forward
- The population mean of a company's racing bicycles is 9.07 kg (20.0 1b) with a population standard deviation of 0.40 kg. If the distribution is approximately normal, determine (a) the percentage of bicycles less than 8.30 kg, (b) the percentage of bicycles greater than 10.00 kg, and (c) the percentage of bicycles between 8.00 and 10.10 kg.arrow_forwardA cell phone manufacturer has hired you to estimate the population mean of the battery lifetimes for all phones of their latest model. You decide to measure battery lifetime by recording the time it takes for the battery charge to run out while a tester is streaming videos on the phones continuously. Then you select a random sample of 45 cell phones of the manufacturer's latest model and record their battery lifetimes. Assume that the population standard deviation of the battery lifetimes for that cell phone model (using your method of measurement) is 2.42 hours. Based on your sample, follow the steps below to construct a 95% confidence interval for the population mean of the battery lifetimes for all phones of the manufacturer's latest model. (If necessary, consult a list of formulas.) (a) Click on "Take Sample" to see the results from your random sample of 45 phones of the manufacturer's latest model. Take Sample Sample size: 0 Number of phones Point estimate: 0 45 Sample mean…arrow_forwardA random survey of 75 death row inmates revealed that the mean length of time on death row is 17.1 years with a standard deviation of 6.5 years. Conduct a hypothesis test to determine if the population mean time on death row could likely be 15 years or not.arrow_forward
- The blood platelet counts of a group of women have a bell-shaped distribution with a mean of 253.8 and a standard deviation of 61.7. What is the approximate percentage of women with platelet counts between 192.1 and 315.5?arrow_forwardA random sample of sizen=20 has the mean 20 and standard deviation 5. What is the standard error of the mean ?arrow_forwardA random sample of 42 KU college students gave a mean age of their vehicles of 11.3 years and a standard deviation of 3.4 years. A separate random sample of 38 KU college employees gave a mean vehicle age of 9.2 years with a standard deviation of 3.1 years. Find a 90% confidence interval for the difference in the population mean of vehicle ages between students and employees, u1-u2. Use students as the first population.arrow_forward
arrow_back_ios
arrow_forward_ios
Recommended textbooks for you
 MATLAB: An Introduction with ApplicationsStatisticsISBN:9781119256830Author:Amos GilatPublisher:John Wiley & Sons Inc
 Probability and Statistics for Engineering and th...StatisticsISBN:9781305251809Author:Jay L. DevorePublisher:Cengage Learning
 Statistics for The Behavioral Sciences (MindTap C...StatisticsISBN:9781305504912Author:Frederick J Gravetter, Larry B. WallnauPublisher:Cengage Learning
 Elementary Statistics: Picturing the World (7th E...StatisticsISBN:9780134683416Author:Ron Larson, Betsy FarberPublisher:PEARSON
 The Basic Practice of StatisticsStatisticsISBN:9781319042578Author:David S. Moore, William I. Notz, Michael A. FlignerPublisher:W. H. Freeman
 Introduction to the Practice of StatisticsStatisticsISBN:9781319013387Author:David S. Moore, George P. McCabe, Bruce A. CraigPublisher:W. H. Freeman

MATLAB: An Introduction with Applications
Statistics
ISBN:9781119256830
Author:Amos Gilat
Publisher:John Wiley & Sons Inc

Probability and Statistics for Engineering and th...
Statistics
ISBN:9781305251809
Author:Jay L. Devore
Publisher:Cengage Learning

Statistics for The Behavioral Sciences (MindTap C...
Statistics
ISBN:9781305504912
Author:Frederick J Gravetter, Larry B. Wallnau
Publisher:Cengage Learning

Elementary Statistics: Picturing the World (7th E...
Statistics
ISBN:9780134683416
Author:Ron Larson, Betsy Farber
Publisher:PEARSON

The Basic Practice of Statistics
Statistics
ISBN:9781319042578
Author:David S. Moore, William I. Notz, Michael A. Fligner
Publisher:W. H. Freeman

Introduction to the Practice of Statistics
Statistics
ISBN:9781319013387
Author:David S. Moore, George P. McCabe, Bruce A. Craig
Publisher:W. H. Freeman