
MATLAB: An Introduction with Applications
6th Edition
ISBN: 9781119256830
Author: Amos Gilat
Publisher: John Wiley & Sons Inc
expand_more
expand_more
format_list_bulleted
Related questions
Question
A
B.) Find the 45th percentile of x. Round the answer to at least two decimal places.
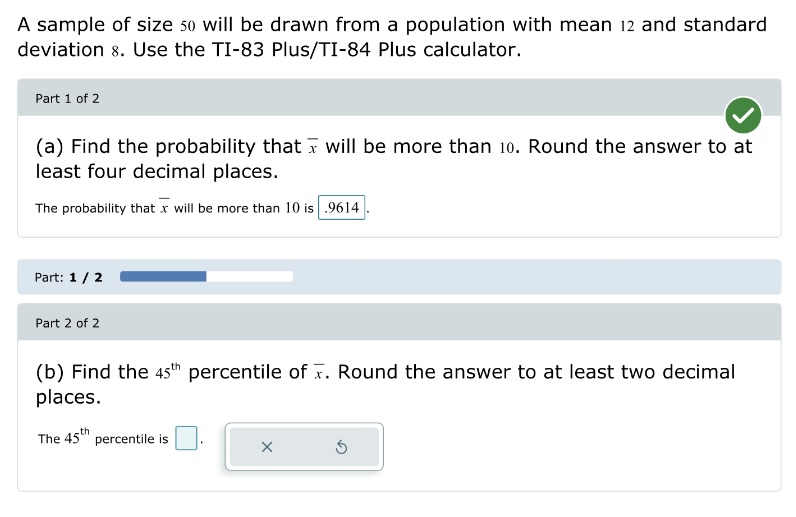

Transcribed Image Text:A sample of size 50 will be drawn from a population with mean 12 and standard
deviation 8. Use the TI-83 Plus/TI-84 Plus calculator.
Part 1 of 2
(a) Find the probability that will be more than 10. Round the answer to at
least four decimal places.
The probability that will be more than 10 is .9614
Part: 1 / 2
Part 2 of 2
(b) Find the 45th percentile of . Round the answer to at least two decimal
places.
The 45th percentile is
X
Ś
Expert Solution
This question has been solved!
Explore an expertly crafted, step-by-step solution for a thorough understanding of key concepts.

Step by stepSolved in 3 steps with 2 images

Knowledge Booster

Similar questions
- Assume that adults have IQ scores that are normally distributed with a mean of 96.6 and a standard deviation 19. Find the first quartile Q,, which is the IQ score separating the bottom 25% from the top 75%. (Hint: Draw a graph.) The first quartile is (Type an integer or decimal rounded to one decimal place as needed.)arrow_forwardPlease show workarrow_forwardQ13. Derive mean of gamma distribution.arrow_forward
- Scores for men on the verbal portion of the SAT-I test are normally distributed with a mean of 545 and a standard deviation of 112 . If 16 men are randomly selected, find the probability that their mean score is at least 590. a. Define the parameter A. x overbar equals The mean score of 16 randomly selected men B. x overbar equals The score of a randomly selected man b. State the mean of x overbar : nothing c. State the standard deviation of x overbar : nothing (use 2 decimal places) d. Find the z-score: nothing (use 2 decimal places) e. Find the probability: nothing (use 4 decimal places)arrow_forwardAssume that adults have IQ scores that are normally distributed with a mean of u= 100 and a standard deviation g= 15. Find the probability that a randomly selected adult has an IQ less than 118. Click to view page 1 of the table. Click to view page 2 of the table. The probability that a randomly selected adult has an IQ less than 118 is (Type an integer or decimal rounded to four decimal places as needed.)arrow_forward. State the interval estimate that contains more possible values of the population mean (precision) for a 90% CI or a 95% CI for the same data.arrow_forward
- Assume that adults have IQ scores that are normally distributed with a mean of 104.5 and a standard deviation 24.7. Find the first quartile Q,. which is the IQ score separating the bottom 25% from the top 75%. (Hint Draw a graph.) The first quartile is (Type an integer or decimal rounded to one decimal place as needed.)arrow_forwardThe scores on a mathematics exam have a mean of 70 and a standard deviation of 6. Find the x-value that corresponds to the z-score 5.19. O 64.8 O 121.9 O 18.1 O 101.1arrow_forwardAssume that adults have IQ scores that are normally distributed with a mean of 97.2 and a standard deviation 21.8. Find the first quartile Q₁, which is the IQ score separating the bottom 25% from the top 75%. (Hint: Draw a graph.) The first quartile is. (Type an integer or decimal rounded to one decimal place as needed.)arrow_forward
arrow_back_ios
arrow_forward_ios
Recommended textbooks for you
- MATLAB: An Introduction with ApplicationsStatisticsISBN:9781119256830Author:Amos GilatPublisher:John Wiley & Sons Inc
 Probability and Statistics for Engineering and th...StatisticsISBN:9781305251809Author:Jay L. DevorePublisher:Cengage Learning
 Statistics for The Behavioral Sciences (MindTap C...StatisticsISBN:9781305504912Author:Frederick J Gravetter, Larry B. WallnauPublisher:Cengage Learning
  Elementary Statistics: Picturing the World (7th E...StatisticsISBN:9780134683416Author:Ron Larson, Betsy FarberPublisher:PEARSON
 The Basic Practice of StatisticsStatisticsISBN:9781319042578Author:David S. Moore, William I. Notz, Michael A. FlignerPublisher:W. H. Freeman
 Introduction to the Practice of StatisticsStatisticsISBN:9781319013387Author:David S. Moore, George P. McCabe, Bruce A. CraigPublisher:W. H. Freeman
MATLAB: An Introduction with Applications
Statistics
ISBN:9781119256830
Author:Amos Gilat
Publisher:John Wiley & Sons Inc
Probability and Statistics for Engineering and th...
Statistics
ISBN:9781305251809
Author:Jay L. Devore
Publisher:Cengage Learning
Statistics for The Behavioral Sciences (MindTap C...
Statistics
ISBN:9781305504912
Author:Frederick J Gravetter, Larry B. Wallnau
Publisher:Cengage Learning
Elementary Statistics: Picturing the World (7th E...
Statistics
ISBN:9780134683416
Author:Ron Larson, Betsy Farber
Publisher:PEARSON
The Basic Practice of Statistics
Statistics
ISBN:9781319042578
Author:David S. Moore, William I. Notz, Michael A. Fligner
Publisher:W. H. Freeman
Introduction to the Practice of Statistics
Statistics
ISBN:9781319013387
Author:David S. Moore, George P. McCabe, Bruce A. Craig
Publisher:W. H. Freeman