
MATLAB: An Introduction with Applications
6th Edition
ISBN: 9781119256830
Author: Amos Gilat
Publisher: John Wiley & Sons Inc
expand_more
expand_more
format_list_bulleted
Related questions
Question
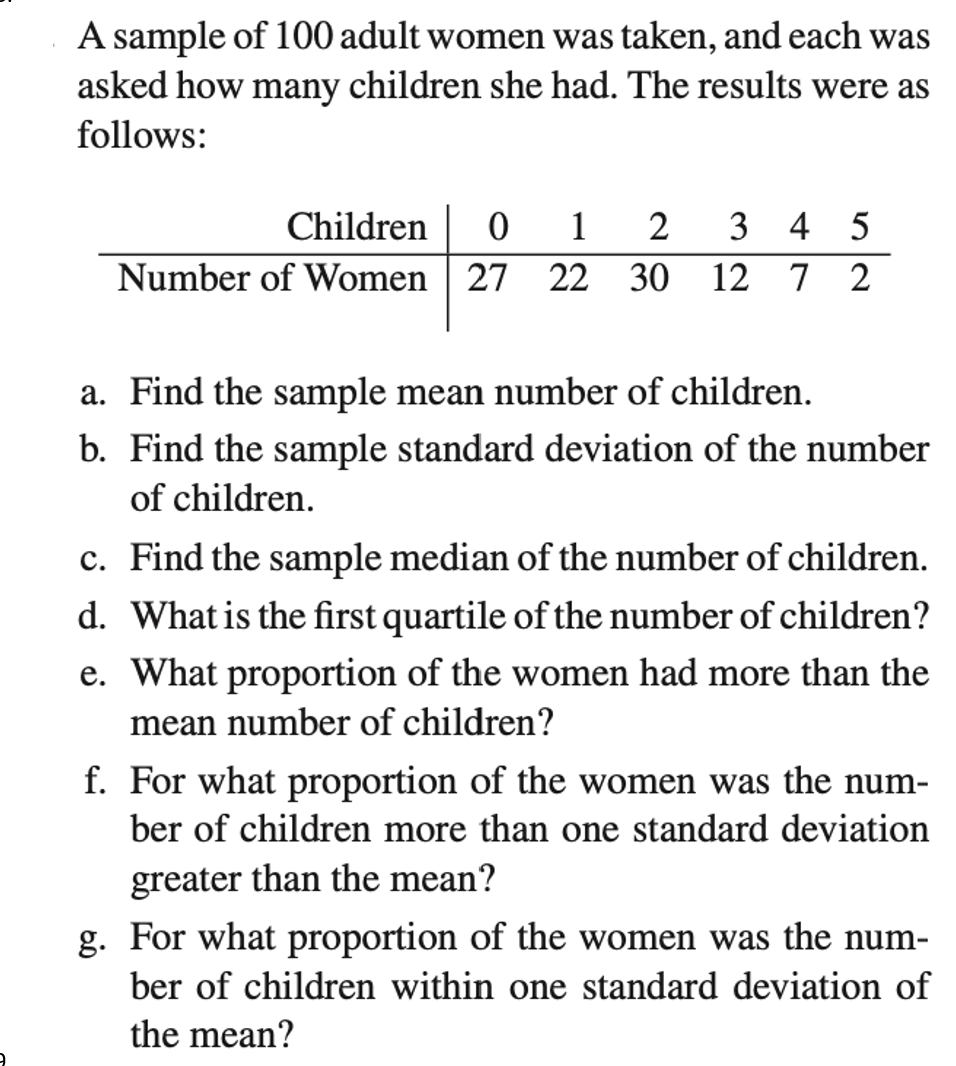

Transcribed Image Text:A sample of 100 adult women was taken, and each was
asked how many children she had. The results were as
follows:
Children 0 1 2 3 4 5
Number of Women 27 22 30 12 7 2
a. Find the sample mean number of children.
b. Find the sample standard deviation of the number
of children.
c. Find the sample median of the number of children.
d. What is the first quartile of the number of children?
e. What proportion of the women had more than the
mean number of children?
f. For what proportion of the women was the num-
ber of children more than one standard deviation
greater than the mean?
g. For what proportion of the women was the num-
ber of children within one standard deviation of
the mean?
Expert Solution
This question has been solved!
Explore an expertly crafted, step-by-step solution for a thorough understanding of key concepts.

Step by stepSolved in 4 steps

Knowledge Booster

Similar questions
- For the data set given, what is the standard error of the sampling distribution of mean difference scores for n=4. a. .91 b. 2.25 c. 3.33 d. .52arrow_forwardA primary measure of dispersion for sample data is the sample standard deviation, s. Choose the best option to explain what the meaning of the sample standard deviation is, in general. A. The distance between one observation and the mean. B. The average distance of an observation from the middle of the distribution. C. The average distance between observations in the sample. D. The distance between the third and first quartiles.arrow_forward6. A sample of 100 adult women was taken, and each was asked how many children she had. The results were as follows: Children 0 Number of 24 Women 1 20 2 35 3 13 4 7 5 1 a. Find the sample mean number of children. b. Find the sample standard deviation of the number of children. c. Find the sample median of the number of children. d. What is the first quartile of the number of children? e. What proportion of the women had more than the mean number of children? f. For what proportion of the women was the number of children more than one standard deviation greater than the mean? g. For what proportion of the women was the number of children within one standard deviation of the mean?arrow_forward
- 17arrow_forward4. Find each value requested for the distribution of scores in the following table. а. п b. ΣΧ C. Σχ f 1 4 2 3 3 2 5 1 3 UNGarrow_forwardThe average income in a state was $64 comma 64,000 per person per year. Suppose the standard deviation is $29 comma 29,000 and the distribution is right-skewed. Suppose we take a random sample of 100 residents of the state. Complete parts (a) and (b) below. a. What value should we expect for the sample mean? Why? b. What is the standard error for the sample mean?arrow_forward
- Task: Find the Bowley's coefficient of skewness for the following series 2, 4, 6, 8, 10, 12, 14, 16, 18, 20, 22arrow_forwardFind the weighted estimate, p to test the claim that p, = p2. Use a = 0.05. The sample statistics listed below are from independent samples. n, = 50, x, = 35, and = 60, x, = 40 O A. 0.682 O B. 0.238 C. 1.367 D. 0.328arrow_forwardBill Alther is a zoologist who studies Anna's hummingbird (Calypte anna). (Reference: Hummingbirds, K. Long, W. Alther.) Suppose that in a remote part of the Grand Canyon, a random sample of six of these birds was caught, weighed, and released. The weights (in grams) were as follows. 3.7 2.9 3.8 4.2 4.8 3.1 The sample mean is = 3.75 grams. Let x be a random variable representing weights of hummingbirds in this part of the Grand Canyon. We assume that x has a normal distribution and σ = 0.64 gram. Suppose it is known that for the population of all Anna's hummingbirds, the mean weight is μ = 4.30 grams. Do the data indicate that the mean weight of these birds in this part of the Grand Canyon is less than 4.30 grams? Use ? = 0.10. (a) What is the level of significance? (Enter a number.) State the null and alternate hypotheses. Will you use a left-tailed, right-tailed, or two-tailed test? H0: μ = 4.3 g; H1: μ > 4.3 g; right-tailed H0: μ < 4.3 g; H1: μ = 4.3 g; left-tailed…arrow_forward
- The average price of a college math textbook is $165 and the standard deviation is $25. Suppose that 10 textbooks are randomly chosen. Round all answers to 4 decimal places where possible. a. What is the distribution of X? X - N( b. For the group of 10, find the probability that the average price is between $162 and $170. c. Find the third quartile for the average textbook price for this sample size. $ the nearest cent) d. For part b), is the assumption that the distribution is normal necessary? O No Yes (round toarrow_forwardGiven the data set below find the following; 45, 34, 65, 20, 15, 25 a. Compute the sample mean b. Compute the sample standard deviation c. Compute the standard error of the mean.arrow_forwardQ6. Select the best response. The sampling distribution of the mean will be approximately Normaleven when the population is not exactly Normal as long as the sample is: A. medium B. large C. smallarrow_forward
arrow_back_ios
SEE MORE QUESTIONS
arrow_forward_ios
Recommended textbooks for you
- MATLAB: An Introduction with ApplicationsStatisticsISBN:9781119256830Author:Amos GilatPublisher:John Wiley & Sons Inc
 Probability and Statistics for Engineering and th...StatisticsISBN:9781305251809Author:Jay L. DevorePublisher:Cengage Learning
 Statistics for The Behavioral Sciences (MindTap C...StatisticsISBN:9781305504912Author:Frederick J Gravetter, Larry B. WallnauPublisher:Cengage Learning
  Elementary Statistics: Picturing the World (7th E...StatisticsISBN:9780134683416Author:Ron Larson, Betsy FarberPublisher:PEARSON
 The Basic Practice of StatisticsStatisticsISBN:9781319042578Author:David S. Moore, William I. Notz, Michael A. FlignerPublisher:W. H. Freeman
 Introduction to the Practice of StatisticsStatisticsISBN:9781319013387Author:David S. Moore, George P. McCabe, Bruce A. CraigPublisher:W. H. Freeman
MATLAB: An Introduction with Applications
Statistics
ISBN:9781119256830
Author:Amos Gilat
Publisher:John Wiley & Sons Inc
Probability and Statistics for Engineering and th...
Statistics
ISBN:9781305251809
Author:Jay L. Devore
Publisher:Cengage Learning
Statistics for The Behavioral Sciences (MindTap C...
Statistics
ISBN:9781305504912
Author:Frederick J Gravetter, Larry B. Wallnau
Publisher:Cengage Learning
Elementary Statistics: Picturing the World (7th E...
Statistics
ISBN:9780134683416
Author:Ron Larson, Betsy Farber
Publisher:PEARSON
The Basic Practice of Statistics
Statistics
ISBN:9781319042578
Author:David S. Moore, William I. Notz, Michael A. Fligner
Publisher:W. H. Freeman
Introduction to the Practice of Statistics
Statistics
ISBN:9781319013387
Author:David S. Moore, George P. McCabe, Bruce A. Craig
Publisher:W. H. Freeman