Concept explainers
A researcher wants to know whether an educational video about genetics is effective. This researcher created a quiz assessing knowledge about genetics. She recruited 6 undergraduates and gave them the quiz as a pre-test. Then they watched the educational video, and took the test a second time.
Student Pre-test Post-test
Anne 2 7
Bob 4 5
Cathy 5 7
Dave 7 8
Emma 2 9
Fred 4 6
Compute the r-square estimate of the effect size for this test
Given that,
A researcher wants to know whether an educational video about genetics is effective. This researcher created a quiz assessing knowledge about genetics. She recruited 6 undergraduates and gave them the quiz as a pre-test. Then they watched the educational video, and took the test a second time.
Sample size
The difference between two paired samples is calculated using formula as follows:
|
pretest |
posttest |
Difference (d) |
| 2 | 7 | -5 |
| 4 | 5 | -1 |
| 5 | 7 | -2 |
| 7 | 8 | -1 |
| 2 | 9 | -7 |
| 4 | 6 | -2 |
Mean and standard deviation of difference is calculated using EXCEL functions as given below:
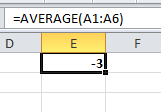
Mean: “=AVERAGE (select array of data values)”
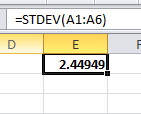
Standard deviation: “=STDEV (select array of data values)”
The mean of the difference is

Standard deviation of difference

Trending nowThis is a popular solution!
Step by stepSolved in 2 steps with 2 images

- Please answer these questions thanksarrow_forwardBusinesses know that customers often respond to background music. Do they also respond to odors? One study of this question took place in a small pizza restaurant in France on two Saturday evenings in May. On one of these evenings, a relaxing lavender odor was spread through the restaurant. On the other evening no scent was used. The data gives the time, in minutes, that two samples of 30 customers spent in the restaurant and the amount they spent in euros. No odor Lavender Minutes Euros spent Minutes Euros spent 103103 15.915.9 9292 21.921.9 6868 18.518.5 126126 18.518.5 7979 15.915.9 114114 22.322.3 106106 18.518.5 106106 21.921.9 7272 18.518.5 8989 18.518.5 121121 21.921.9 137137 24.924.9 9292 15.915.9 9393 18.518.5 8484 15.915.9 7676 22.522.5 7272 15.915.9 9898 21.521.5 9292 15.915.9 108108 21.921.9 8585 15.915.9 124124 21.521.5 6969 18.518.5 105105 18.518.5 7373 18.518.5 129129 25.525.5 8787 18.518.5 103103 18.518.5 109109 20.520.5 107107…arrow_forwardhe data on the number of chocolate chips per bag for 42 bags of Chips Ahoy! cookies were obtained by the students in an introductory statistics class at the United States Air Force Academy in response to the Chips Ahoy! 1,000 Chips Challenge sponsored by Nabisco, the makers of Chips Ahoy! Use the data collected by the students to answer the following questions and to conduct the analyses required in each part. They found ¯xx¯ = 1261.6 and s = 117.6 a. Determine a 95% confidence interval for the mean number of chips per bag for all bags of Chips Ahoy! cookies. ≤μ≤≤μ≤ b. Interpret your result in words. c. Can you conclude that the average bag of Chips Ahoy! Cookies contain at least 1000 chocolate chips? yes noarrow_forward
- A researcher wants to find the effect of a special diet on systolic blood pressure. A sample of 7 adults was selected to start them on this diet for 3 months. Based on this information, can it be stated that systolic blood pressure changes with the special diet? The test statistic that will determine whether systolic blood pressure changes with the special diet is...... A. 1.23 B. 0.48 C. 18.1 D. 21.08 E. 4.08arrow_forwardOst watched Ani... Question 2 Y Part 1 of 4 A doctor in Cleveland wants to know whether the average life span for heart disease patients at four hospitals in the city differ. The data below represents the life span, in years, of heart disease patients from each hospital. Perform an ANOVA test with a 9% level of significance to test whether the average life span of heart disease patients in Cleveland differs depending on the hospital that treats them Life Span of Patients Treated at Hospital 1: 7.4, 7.8, 7.7, 7.5, 8, 8.2, 7.8, 8.6, 8, 7.8, 8.3, 8.3, 8, 7.6, 8.2, 7.9, 7.3, 8, 8.6, 7.3, 8.3, 8, 7.8, 8, 7.8, 8.1, 8.1, 8, 7.6, 7.6, 7.7, 7.4, 7.7, 7.8, 7.8 Life Span of Patients Treated at Hospital 2: 7.9, 7.9, 8.2, 8, 8.1, 8.5, 8.3, 8.4, 8, 8.2, 7.7, 8, 8, 7.8, 7.9, 8.1, 8.1, 7.8, 7.9, 8, 8.5, 8.3, 8.2, 8.3, 7.8, 7.9 Life Span of Patients Treated at Hospital 3: 8.2, 8.1, 7.4, 8.7, 8.6, 8.2, 7.9, 8.1, 8.1, 8.3, 8.3, 8, 7.6, 8, 7.4, 8.6, 8.2, 8.2, 7.9, 7.7, 8.1, 7.9, 8, 8.3 Life Span of…arrow_forwardUse the following information to answer the question. A researcher wants to study different messaging platforms by collecting data on 40 individuals. Half of the individuals only use iMessage while the other half only use What's App. For the individuals who only used iMessage, they sent an average of 280 messages with a sample variance of 170 in the past week. For the individuals who only used What's App, they sent an average of 295 messages with a sample variance of 182 in the past week. Determine if there is a significant difference between the average messages sent between the two groups of individuals. Use a significance level of 1%. What is the null hypothesis? Group of answer choices A. The iMessage group on average sent more messages than the What's App group. B. The iMessage group on average sent less messages than the What's App group. C. There is no difference in the average number of messages sent between the two groups. D. There is a difference in the average…arrow_forward
- A group of statisticians decides they will answer the question: Has the wolf reintroduction to Yellowstone been detrimental to elk herds in the park? They decide that each of the four data scientists will take a quadrant of the park to collect a sample from as randomly as possible. They decide they will collect the sample during the winter, the time the elk herds are most stressed. They agree to trust each others professional judgement when it comes to the health of the individual elk in the herd. They will give each elk a grade out of 3pts: 1 pt for sick, 2pts for fair, and 3pts for healthy. They then share their data and compare to create a final report on the overall health of the elk in the park. In this scenario, what kind of random sampling did the statisticians use?arrow_forwardWhich of the following would not be consideredarrow_forward
 MATLAB: An Introduction with ApplicationsStatisticsISBN:9781119256830Author:Amos GilatPublisher:John Wiley & Sons Inc
 Probability and Statistics for Engineering and th...StatisticsISBN:9781305251809Author:Jay L. DevorePublisher:Cengage Learning
 Statistics for The Behavioral Sciences (MindTap C...StatisticsISBN:9781305504912Author:Frederick J Gravetter, Larry B. WallnauPublisher:Cengage Learning
 Elementary Statistics: Picturing the World (7th E...StatisticsISBN:9780134683416Author:Ron Larson, Betsy FarberPublisher:PEARSON
 The Basic Practice of StatisticsStatisticsISBN:9781319042578Author:David S. Moore, William I. Notz, Michael A. FlignerPublisher:W. H. Freeman
 Introduction to the Practice of StatisticsStatisticsISBN:9781319013387Author:David S. Moore, George P. McCabe, Bruce A. CraigPublisher:W. H. Freeman


