
MATLAB: An Introduction with Applications
6th Edition
ISBN: 9781119256830
Author: Amos Gilat
Publisher: John Wiley & Sons Inc
expand_more
expand_more
format_list_bulleted
Related questions
Question
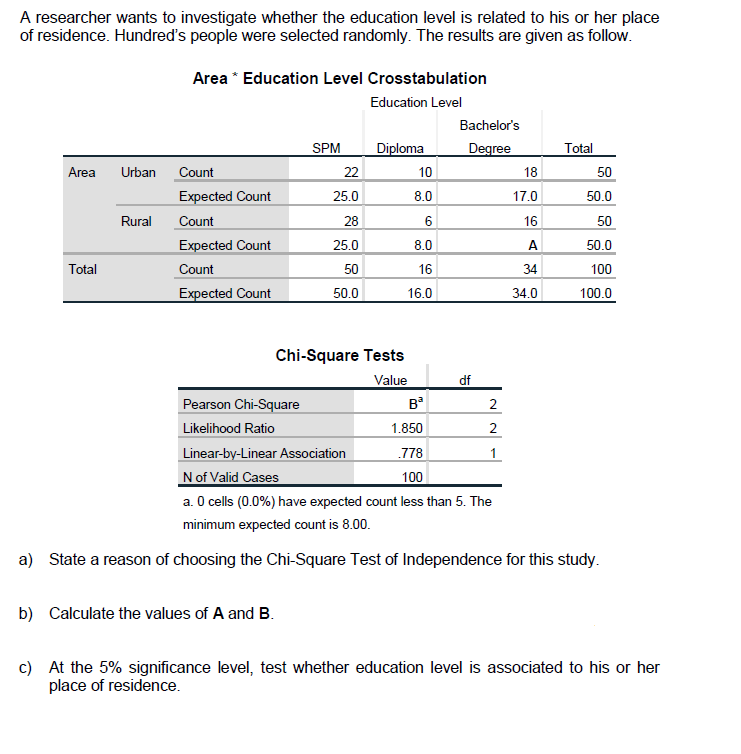

Transcribed Image Text:A researcher wants to investigate whether the education level is related to his or her place
of residence. Hundred's people were selected randomly. The results are given as follow.
Area * Education Level Crosstabulation
Education Level
Bachelor's
SPM
Diploma
Degree
Total
Area
Urban
Count
22
10
18
50
Expected Count
25.0
8.0
17.0
50.0
Rural
Count
28
16
50
Expected Count
25.0
8.0
A
50.0
Total
Count
50
16
34
100
Expected Count
50.0
16.0
34.0
100.0
Chi-Square Tests
Value
df
Pearson Chi-Square
в
2
Likelihood Ratio
1.850
2
Linear-by-Linear Association
.778
1
N of Valid Cases
a. O cells (0.0%) have expected count less than 5. The
100
minimum expected count is 8.00.
a) State a reason of choosing the Chi-Square Test of Independence for this study.
b) Calculate the values of A and B.
c) At the 5% significance level, test whether education level is associated to his or her
place of residence.
Expert Solution
This question has been solved!
Explore an expertly crafted, step-by-step solution for a thorough understanding of key concepts.

Step by stepSolved in 2 steps

Knowledge Booster

Similar questions
- A government agency computed the proportion of U.S. residents who lived in each of four geographic regions in a particular year. Then a simple random sample was drawn of 1000 people living in the United States in the current year. The following table presents the results. Region Past YearProportion ObservedCounts Northeast 0.171 150 Midwest 0.245 235 South 0.357 398 West 0.227 217 Send data to Excel Can you conclude that the proportions of people living in the various regions changed between the current year and the past year? Use the 0.05 level of significance and the P-value method with the TI-84 Plus calculator. What the P value?arrow_forwardData were gathered on how high dolphins jump from the surface of the water based on body length. The following data was obtained from 10 randomly selected dolphins in Miami, Florida. Body Length (in feet) Height of Jump (in feet) 5.5 15 6 15 6.7 17.5 7.2 17 7.5 18.1 8.2 18.7 8.2 17.6 8.5 19.2 9 22.3 9.5 19.3 What is the value of r and its interpretation?arrow_forwardWhat is the value of SS for the following sample? 1,3,2,2?arrow_forward
- How many samples or treatments are here? 490 undergraduate students at a state university in the southwestern region of the United States were surveyed. Each student in the sample was classified according to class standing (freshman, sophomore, junior, or senior) and body are category (body piercings only, tattoos only, both tattoos and body piercings, no body art). Use the data in the accompanying table to determine if there is an association between class standing and body art category. Assume that it is reasonable to regard the sample as representative of the students at this university. Use α = 0.01. Freshman Sophmore Junior Senior Body Piercings 61 7 14 86 Only Tattoos 43 11 10 64 Only Mildly Piercings and Tattoos 20 9 7…arrow_forwardA random sample of employees participating in a company fitness program were asked how many days they logged an exercise activity in the past month. Their responses are reported in the histogram below.Based on the histogram above, what is the class width? Clas width = ? Days What is the sample size? Sample size = ? employeesarrow_forwardNonearrow_forward
- The city of Hampton is surveying households to see if the number of cats per household has changed over the past decade. The last known average of cats per household was 1.08. What statistical procedure should you use to analyze these data? O one sample z test Oone sample t test O correlated groups t test O independent groups t testarrow_forwardLast school year, the student body of a local university consisted of 30% freshmen, 24% sophomores, 26% juniors, and 20% seniors. A sample of 400 students taken from this year's student body showed the following number of students in each classification. Freshmen 113 Sophomores 98 Juniors 115 Seniors 74 We are interested in determining whether or not there has been a significant change in the classifications between the last school year and this school year. The calculated value for the test statistic equals Select one: a. .54. b. .65. c. 2.063. d. 2.664.arrow_forward
arrow_back_ios
arrow_forward_ios
Recommended textbooks for you
- MATLAB: An Introduction with ApplicationsStatisticsISBN:9781119256830Author:Amos GilatPublisher:John Wiley & Sons Inc
 Probability and Statistics for Engineering and th...StatisticsISBN:9781305251809Author:Jay L. DevorePublisher:Cengage Learning
 Statistics for The Behavioral Sciences (MindTap C...StatisticsISBN:9781305504912Author:Frederick J Gravetter, Larry B. WallnauPublisher:Cengage Learning
  Elementary Statistics: Picturing the World (7th E...StatisticsISBN:9780134683416Author:Ron Larson, Betsy FarberPublisher:PEARSON
 The Basic Practice of StatisticsStatisticsISBN:9781319042578Author:David S. Moore, William I. Notz, Michael A. FlignerPublisher:W. H. Freeman
 Introduction to the Practice of StatisticsStatisticsISBN:9781319013387Author:David S. Moore, George P. McCabe, Bruce A. CraigPublisher:W. H. Freeman
MATLAB: An Introduction with Applications
Statistics
ISBN:9781119256830
Author:Amos Gilat
Publisher:John Wiley & Sons Inc
Probability and Statistics for Engineering and th...
Statistics
ISBN:9781305251809
Author:Jay L. Devore
Publisher:Cengage Learning
Statistics for The Behavioral Sciences (MindTap C...
Statistics
ISBN:9781305504912
Author:Frederick J Gravetter, Larry B. Wallnau
Publisher:Cengage Learning
Elementary Statistics: Picturing the World (7th E...
Statistics
ISBN:9780134683416
Author:Ron Larson, Betsy Farber
Publisher:PEARSON
The Basic Practice of Statistics
Statistics
ISBN:9781319042578
Author:David S. Moore, William I. Notz, Michael A. Fligner
Publisher:W. H. Freeman
Introduction to the Practice of Statistics
Statistics
ISBN:9781319013387
Author:David S. Moore, George P. McCabe, Bruce A. Craig
Publisher:W. H. Freeman