MATLAB: An Introduction with Applications
6th Edition
ISBN: 9781119256830
Author: Amos Gilat
Publisher: John Wiley & Sons Inc
expand_more
expand_more
format_list_bulleted
Question
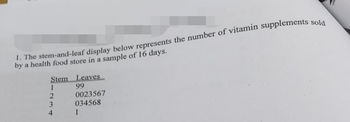
a. Construct a boxplot for the data in this sample
b. What type of shape does the distribution of the sample appear to have?

Transcribed Image Text:1. The stem-and-leaf display below represents the number of vitamin supplements sold
by a health food store in a sample of 16 days.
Stem
1
2
4
Leaves
99
0023567
034568
1
Expert Solution
This question has been solved!
Explore an expertly crafted, step-by-step solution for a thorough understanding of key concepts.
This is a popular solution
Trending nowThis is a popular solution!
Step by stepSolved in 2 steps with 1 images

Knowledge Booster
Similar questions
- Consider a sample with data values of 10, 20, 15, 18, and 11. Compute the range and interquartile range.arrow_forwardSuppose you are interested in knowing the proportion of Texas A&M students who have their own subscription to Netflix. Everyone in a class of 77 students takes a random sample of 100 Texas A&M students and asks them if they have their own Netflix subscription. Each person calculates the proportion of their sample with a subscription and we make a histogram of the 77 proportions. What kind of distribution would be displayed in that histogram? a. Population Distribution b. Sampling Distribution c. Data Distribution d. Parent Distribution e. More than one of the abovearrow_forwardb) What is the P Value?arrow_forward
- Consider a sample with data values of 10, 20, 16, 12, and 17. Compute the mean and median. mean median 14arrow_forwardConsider the following data: 2, 10, 14, 12, 4, 4, 10 Step 1 of 3: Calculate the value of the sample variance. Round your answer to one decimal place.arrow_forwardConsider these sample data: x1=15, x2=9, x3=3, x4=22. a. Find n. b. Compute ∑xi. c.Determine x. a.n=arrow_forward
- 3) What graphs can help us identify a normal distribution? a. Dotplot b. Histogram c. Boxplot d. Normal probability plot pick one a, b, c, d b, c a, b a, b, c b, darrow_forwardConsider a sample with data values of 10, 20, 15, 16, and 18. Compute the range and interquartile range.arrow_forward2. Given the following observations from a sample, calculate the mean, the median, and the mode. 4 0 -6 1 -3 -4arrow_forward
- Consider the following two sample data sets. Set 1: 7 5 3 8 9 Set 2: 8 13 14 2 5 a. Calculate the coefficient of variation for each data set. b. Which data set has less consistency (or more variability)?arrow_forward1. Find the mean for the given sample data. 2, 5, 9, 13, 17, 20arrow_forwardConsider the following ordered data. 6 9 9 10 11 11 12 13 14 Find the low, Q1, median, Q3, and high.arrow_forward
arrow_back_ios
SEE MORE QUESTIONS
arrow_forward_ios
Recommended textbooks for you
 MATLAB: An Introduction with ApplicationsStatisticsISBN:9781119256830Author:Amos GilatPublisher:John Wiley & Sons Inc
 Probability and Statistics for Engineering and th...StatisticsISBN:9781305251809Author:Jay L. DevorePublisher:Cengage Learning
 Statistics for The Behavioral Sciences (MindTap C...StatisticsISBN:9781305504912Author:Frederick J Gravetter, Larry B. WallnauPublisher:Cengage Learning
 Elementary Statistics: Picturing the World (7th E...StatisticsISBN:9780134683416Author:Ron Larson, Betsy FarberPublisher:PEARSON
 The Basic Practice of StatisticsStatisticsISBN:9781319042578Author:David S. Moore, William I. Notz, Michael A. FlignerPublisher:W. H. Freeman
 Introduction to the Practice of StatisticsStatisticsISBN:9781319013387Author:David S. Moore, George P. McCabe, Bruce A. CraigPublisher:W. H. Freeman

MATLAB: An Introduction with Applications
Statistics
ISBN:9781119256830
Author:Amos Gilat
Publisher:John Wiley & Sons Inc

Probability and Statistics for Engineering and th...
Statistics
ISBN:9781305251809
Author:Jay L. Devore
Publisher:Cengage Learning

Statistics for The Behavioral Sciences (MindTap C...
Statistics
ISBN:9781305504912
Author:Frederick J Gravetter, Larry B. Wallnau
Publisher:Cengage Learning

Elementary Statistics: Picturing the World (7th E...
Statistics
ISBN:9780134683416
Author:Ron Larson, Betsy Farber
Publisher:PEARSON

The Basic Practice of Statistics
Statistics
ISBN:9781319042578
Author:David S. Moore, William I. Notz, Michael A. Fligner
Publisher:W. H. Freeman

Introduction to the Practice of Statistics
Statistics
ISBN:9781319013387
Author:David S. Moore, George P. McCabe, Bruce A. Craig
Publisher:W. H. Freeman