
MATLAB: An Introduction with Applications
6th Edition
ISBN: 9781119256830
Author: Amos Gilat
Publisher: John Wiley & Sons Inc
expand_more
expand_more
format_list_bulleted
Related questions
Question
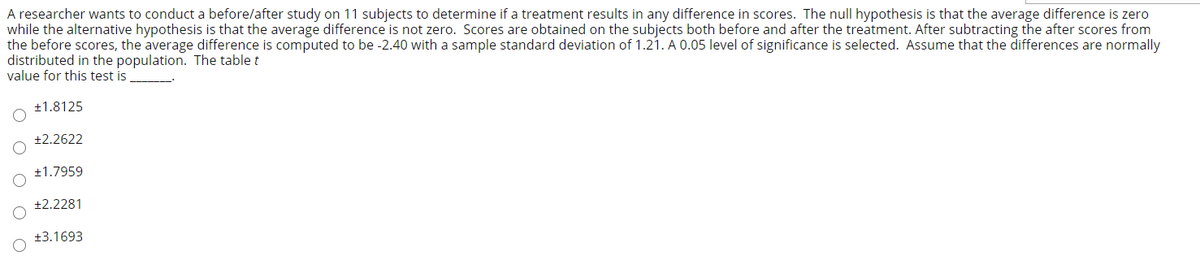

Transcribed Image Text:A researcher wants to conduct a before/after study on 11 subjects to determine if a treatment results in any difference in scores. The null hypothesis is that the average difference is zero
while the alternative hypothesis is that the average difference is not zero. Scores are obtained on the subjects both before and after the treatment. After subtracting the after scores from
the before scores, the average difference is computed to be -2.40 with a sample standard deviation of 1.21. A 0.05 level of significance is selected. Assume that the differences are normally
distributed in the population. The table t
value for this test is
+1.8125
+2.2622
+1.7959
+2.2281
+3.1693
Expert Solution
This question has been solved!
Explore an expertly crafted, step-by-step solution for a thorough understanding of key concepts.

This is a popular solution

Trending nowThis is a popular solution!

Step by stepSolved in 2 steps

Knowledge Booster


Learn more about
Need a deep-dive on the concept behind this application? Look no further. Learn more about this topic, statistics and related others by exploring similar questions and additional content below.Similar questions
- A sample of 200 corporate managers produced the mean job-related stress score of 7.9 with a standard deviation of .65. Another sample of 300 college professors produced the mean job-related stress score of 5.4 with a standard deviation of .90. The null hypothesis is that the mean job-related stress score for all corporate managers is equal to the mean job-related stress score for all college professors. The alternative hypothesis is that the mean job-related stress score for all corporate managers is not equal to the mean job-related stress score for all college professors. The significance level is 1%. What are the critical values of z? a. –2.33 and 2.33 b. –2.17 and 2.17 c. –1.96 and 1.96 d. –2.58 and 2.58arrow_forwardScores on a certain "IQ" test for 18-25 year olds are normally distributed. A researcher believes that the average IQ score for students at a certain NJ college is less than 110 points, and so wants to test this hypothesis. The researcher obtain a SRS of 45 student IQ scores from school records and found the mean of the 45 results was 108 with a sample standard deviation of 21. The level of significance (alpha) used for this problem is 0.05. What is the appropriate test statistic (Student must complete by showing by formula using the ap- propriate values in that formula "showing work" and the final answer and appropriate label)? O T test score = (108-110)/(21/sqrt(45)) = -.639 T test score (108-110)/(21/sqrt(45)) = .639 %3D OT test score = (110-108)/(21/sqrt(45)) = .639 %3D T test score (108-110)/(45/sqrt(21)) =-.2037 %3D 素arrow_forwardDuring a recent year, the mean ACT score for all college bound students had a mean of 24.65 and a standard deviation of 4.01. The director of Stanley Kaplan is interested in knowing whether taking their course causes a difference on ACT scores. She takes a random sample of 444 seniors and finds their mean to be 25.44. Test the null hypothesis at the .05 level of significance.arrow_forward
- According to a city's estimate, people on average arrive 1.5 hours early for domestic flights. The population standard deviation is known to be 0.5 hours. A researcher wanted to check if this is true so he took a random sample of 50 people taking domestic flights and found the mean time to be 2.0 hours early. At the 1% significance level, can you conclude that the amount of time people are early for domestic flights is more than what the city claims. Will you reject or not reject the null hypothesis and what is your conclusion in words? O Reject the null hypothesis; the city's claim is true. O Do not reject the null hypothesis; the city's claim is false and people arrive earlier than the city claims. O Reject the null hypothesis; the city's claim is false and people arrive earlier than the city claims. O Do not reject the null hypothesis; the city's claim is true.arrow_forwardOne way to check on how representative a survey is of the population from which it was drawn is to compare various characteristics of the sample with the population characteristics. A typical variable used for this purpose is age. The GSS 2018 found a mean age of 48.69 and a standard deviation of 17.99 for its sample of 1,495 American adults. Assume that we know from census data that the mean age of all American adults is 37.80. What is the research and the null hypotheses for a two-tailed test of means, calculate the t statistic and test the null hypothesis at the .001 significance level, and what is the decision about the null hypothesis?arrow_forwardYou were told that the mean daily cost of a hotel room in downtown St. Louis is $120. You will be needing to rent a hotel room there in the near future and you want to find the best rate. You randomly select a sample of 18 hotel rooms and find that the average cost is $121.33 with a standard deviation of $18.046. At the α = 0.05 significance level, determine if there is enough evidence to reject the claim. What is the decision for this hypothesis test? You were told that the mean daily cost of a hotel room in downtown St. Louis is $120. You will be needing to rent a hotel room there in the near future and you want to find the best rate. You randomly select a sample of 18 hotel rooms and find that the average cost is $121.33 with a standard deviation of $18.046. At the α = 0.05 significance level, determine if there is enough evidence to reject the claim. What is the decision for this hypothesis test? Reject the null because the test statistic is in the critical region and the…arrow_forward
- Bone mineral density (BMD) is a measure of bone strength. Studies show that BMD declines after age 45. The impact of exercise may increase BMD. A random sample of 59 women between the ages of 41 and 45 with no major health problems were studied. The women were classified into one of two groups based upon their level of exercise activity: walking women and sedentary women. The 39 women who walked regularly had a mean BMD of 5.96 with a standard deviation of 1.22. The 20 women who are sedentary had a mean BMD of 4.41 with a standard deviation of 1.02. Which of the following inference procedures could be used to estimate the difference in the mean BMD for these two types of womenarrow_forwardA pharmaceutical company needs to know if its new cholesterol drug, Praxor, is effective at lowering cholesterol levels. It believes that people who take Praxor will average a greater decrease in cholesterol level than people taking a placebo. After the experiment is complete, the researchers find that the 4848 participants in the treatment group lowered their cholesterol levels by a mean of 21.521.5 points with a standard deviation of 2.52.5 points. The 4040 participants in the control group lowered their cholesterol levels by a mean of 20.920.9 points with a standard deviation of 4.14.1 points. Assume that the population variances are not equal and test the company’s claim at the 0.100.10 level. Let the treatment group be Population 1 and let the control group be Population 2. Step 2 of 3 : Compute the value of the test statistic. Round your answer to three decimal places. step 3 of 3 : Conclusion- fail to reject/reject...insufficient/sufficientarrow_forwardTime Spent Studying and Social Mediaarrow_forward
- Do shoppers at the mall spend more money on average the day after Thanksgiving compared to the day after Christmas? The 52 randomly surveyed shoppers on the day after Thanksgiving spent an average of $122. Their standard deviation was $29. The 59 randomly surveyed shoppers on the day after Christmas spent an average of $117. Their standard deviation was $35. What can be concluded at the αα = 0.05 level of significance? For this study, we should use The null and alternative hypotheses would be: H0:H0: H1:H1: The test statistic = (please show your answer to 3 decimal places.) The p-value = (Please show your answer to 4 decimal places.) The p-value is αα Based on this, we should the null hypothesis.arrow_forwardA professional racing team is holding tryouts at its test track. The team requires its drivers to have an average lap time of at most 133 seconds at its test track. The team will use a one sample z-test of significance to determine if they should hire a new driver. An amateur driver completes 8 timed laps of the test track with an average lap time of 136 seconds. If the standard deviation of all lap times at this track is 4.1 seconds, what is the value of the test statistic? Round your answer to two decimal places.arrow_forward
arrow_back_ios
arrow_forward_ios
Recommended textbooks for you
- MATLAB: An Introduction with ApplicationsStatisticsISBN:9781119256830Author:Amos GilatPublisher:John Wiley & Sons Inc
 Probability and Statistics for Engineering and th...StatisticsISBN:9781305251809Author:Jay L. DevorePublisher:Cengage Learning
 Statistics for The Behavioral Sciences (MindTap C...StatisticsISBN:9781305504912Author:Frederick J Gravetter, Larry B. WallnauPublisher:Cengage Learning
  Elementary Statistics: Picturing the World (7th E...StatisticsISBN:9780134683416Author:Ron Larson, Betsy FarberPublisher:PEARSON
 The Basic Practice of StatisticsStatisticsISBN:9781319042578Author:David S. Moore, William I. Notz, Michael A. FlignerPublisher:W. H. Freeman
 Introduction to the Practice of StatisticsStatisticsISBN:9781319013387Author:David S. Moore, George P. McCabe, Bruce A. CraigPublisher:W. H. Freeman
MATLAB: An Introduction with Applications
Statistics
ISBN:9781119256830
Author:Amos Gilat
Publisher:John Wiley & Sons Inc
Probability and Statistics for Engineering and th...
Statistics
ISBN:9781305251809
Author:Jay L. Devore
Publisher:Cengage Learning
Statistics for The Behavioral Sciences (MindTap C...
Statistics
ISBN:9781305504912
Author:Frederick J Gravetter, Larry B. Wallnau
Publisher:Cengage Learning
Elementary Statistics: Picturing the World (7th E...
Statistics
ISBN:9780134683416
Author:Ron Larson, Betsy Farber
Publisher:PEARSON
The Basic Practice of Statistics
Statistics
ISBN:9781319042578
Author:David S. Moore, William I. Notz, Michael A. Fligner
Publisher:W. H. Freeman
Introduction to the Practice of Statistics
Statistics
ISBN:9781319013387
Author:David S. Moore, George P. McCabe, Bruce A. Craig
Publisher:W. H. Freeman