
MATLAB: An Introduction with Applications
6th Edition
ISBN: 9781119256830
Author: Amos Gilat
Publisher: John Wiley & Sons Inc
expand_more
expand_more
format_list_bulleted
Related questions
Question
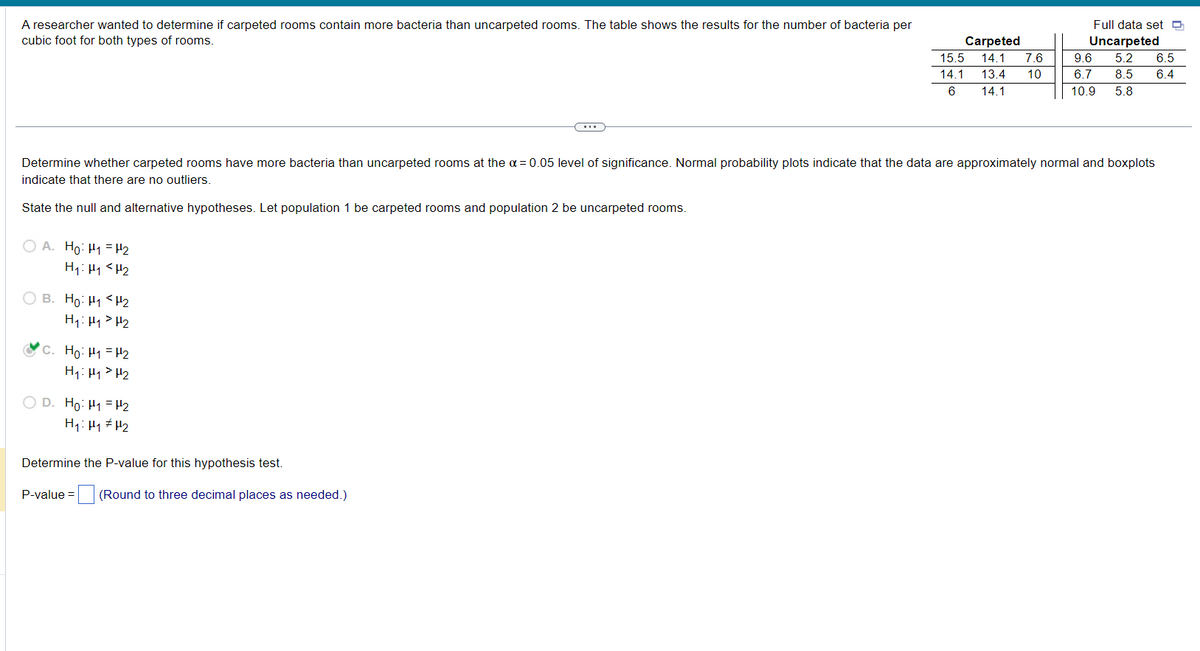

Transcribed Image Text:A researcher wanted to determine if carpeted rooms contain more bacteria than uncarpeted rooms. The table shows the results for the number of bacteria per
cubic foot for both types of rooms.
OA. Ho: H₁ H₂
H₁ H₁ H₂
OB. Ho: H1 H₂
H₁: H₁ H₂
Determine whether carpeted rooms have more bacteria than uncarpeted rooms at the α = 0.05 level of significance. Normal probability plots indicate that the data are approximately normal and boxplots
indicate that there are no outliers.
State the null and alternative hypotheses. Let population 1 be carpeted rooms and population 2 be uncarpeted rooms.
C. Ho: H₁ = 1₂
H₁ H₁ H₂
OD. Ho-H1-H2
H₁: H₁ H₂
C
Determine the P-value for this hypothesis test.
P-value = (Round to three decimal places as needed.)
Carpeted
15.5 14.1 7.6
14.1 13.4 10
14.1
6
Full data set
Uncarpeted
9.6 5.2 6.5
6.7 8.5 6.4
10.9 5.8
Expert Solution
This question has been solved!
Explore an expertly crafted, step-by-step solution for a thorough understanding of key concepts.

This is a popular solution

Trending nowThis is a popular solution!

Step by stepSolved in 3 steps with 1 images

Knowledge Booster

Similar questions
- Scooping ice cream Ice cream usually comes in 1.5 quart boxes (48 fluid ounces), and ice cream scoops hold about 2 ounces. However, there is some variability in the amount of ice cream in a box as well as the amount of ice cream scooped out. We represent the amount of ice cream in the box as X and the amount scooped out as Y. Suppose these random variables have the following means, standard deviations, and variances: mean SD variance Х 48 1.1 1.21 Y 2 0.27 0.0729 An entire box of ice cream, plus 9 scoops from a second box is served at a party. How much ice cream do you expect to have been served at this party? 66 What is the standard deviation of the amount of ice cream served? How much ice cream would you expect to be left in the box after scooping out 2 scoop(s) of ice cream? 46 What is the standard deviation of the amount left in the box?arrow_forwardFind the proportion of Normally distributed observations with a z-score above 0.80. Give your answer to four decimal places. Find the proportion of N.d. observations with a z-score between z1= -0.34 and z2= 2.72. Give your answer to four decimal places.arrow_forwardPatients with two kinds of diagnoses were randomly assigned to one of three types of therapy and the effectiveness of the therapy was measure a 1-to-15 scale (with a higher number indicating greater effectiveness). There were two patients per cell. Use the data available below to comple parts (a) through (d) below. Click the icon to view the data table. Click here to view page 1 of the table of cutoff values for the F distribution. Click here to view page 2 of the table of cutoff values for the F distribution. Click here to view page 3 of the table of cutoff values for the F distribution. Click here to view page 4 of the table of cutoff values for the F distribution (a) Carry out the analysis of variance (use the 0.05 significance level). Complete the analysis of variance table for the data set below. SS MS F Source Columns Rows Interaction Within Total (Round to two decimal places as needed.) Data Table Diagnosis I Diagnosis II Therapy A 5 1 7 Print Therapy B 7 12 Done Therapy C 4282…arrow_forward
- Phosphorous is a chemical that is found in many household cleaning products. Unfortunately, phosphorous also finds its way into surface water, where it can harm fish, plants, and other wildlife. Two methods of phosphorous reduction are being studied. At a random sample of 7 locations, both methods were used and the total phosphorous reduction (mg/L) was recorded. Note: For degrees of freedom d.f. not in the Student's t table, use the closest d.f. that is smaller. In some situations, this choice of d.f. may increase the P-value a small amount and thereby produce a slightly more "conservative" answer. Things that are labelled i underneath a b c, etc are all part of that part.arrow_forwardAn immunologist wants to compare two rabies vaccines. People who had previously received the vaccine were divided into two groups. The first group received a booster dose of type I vaccine and the second group received a booster dose of type II vaccine. Two weeks later the antibody level was measured. The average number of antibodies in each group appears in the following table: Do these data indicate that there is a difference in the effectiveness of the two vaccines used for booster doses? Assume a normal distribution and equal population variances. What type of hypothesis test will allow us to reach a conclusion in the situation posed above? A. Variance test B. Unilateral for difference in proportions C. Bilateral for average difference D. Unilateral for change in effectivenessarrow_forwardThe one-sample chi-square focuses on the distribution of two variables.arrow_forward
- A pharmaceutical company makes tranquilizers. It is assumed that the distribution for the length of time they last is approximately normal. Researchers in a hospital used the drug on a random sample of 9 patients. The effective period of the tranquilizer for each patient (in hours) was as follows: 2.5; 2.8; 3.1; 2.3; 2.3; 2.2; 2.8; 2.1; and 2.4. 1.Which distribution should you use for this problem? (Enter your answer in the form z or tdf where df is the degrees of freedom.) 2. Construct a 95% confidence interval for the population mean length of time. (i) State the confidence interval. (Round your answers to two decimal places.) ( , ) (iii) Calculate the error bound. (Round your answer to two decimal places.)arrow_forwardA pharmaceutical company makes tranquilizers. It is assumed that the distribution for the length of time they last is approximately normal. Researchers in a hospital used the drug on a random sample of 9 patients. The effective period of the tranquilizer for each patient (in hours) was as follows: 2.5; 2.9; 3.1; 2.3; 2.3; 2.2; 2.8; 2.1; and 2.4.arrow_forwardThe table below shows the frequency distribution of the rainfall on 52 consecutive Tuesdays in a certain city. Use the frequency distribution to construct a histogram. Do the data appear to have a distribution that is approximately normal? Class 0-0.19 0.20 -0.39 0.40 -0.59 0.60-0.79 0.80 -0.99 1.00-1.19 1.20-1.39 Frequency 22 13 4 1 5 6 1 Choose the correct histogram below. OA. OB. O C. 30- 20- 10- 0.0 0.2 0.4 0.6 0.8 1.0 1.2 1.4 30- 20- 10- 0+ 0.0 0.2 0.4 0.6 0.8 1.0 1.2 1.4 30- 20- 10- 0+ 0.0 0.2 0.4 0.6 0.8 1.0 1.2 1.4 Q Q Q Do the data appear to have a distribution that is approximately normal? O A. No, it is approximately uniform. OB. No, it is not symmetric. OC. No, it has no obvious maximum. O D. Yes, it is approximately normal.arrow_forward
- Researchers wanted to determine if carpeted rooms contained more bacteria than uncarpeted rooms. To determine the amount of bacteria in a room, researchers pumped the air from the room over a Petri dish at the rate of 1 cubic foot per minute for eight carpeted rooms and eight uncarpeted rooms. Colonies of bacteria were allowed to form in the 16 Petri dishes. The results are given in the table below. Assume the distribution to be approximately normal. Do carpeted rooms have more bacteria than uncarpeted rooms? Carpeted Rooms Uncarpeted Rooms 11.7 12.0 8.2 8.3 7.1 3.8 13.1 7.3 10.6 12.0 10.1 11.1 14.8 10.3 14.0 13.7 What is the critical value(s) for this hypothesis test if group 1 is the carpeted rooms and group 2 is the uncarpeted rooms. 1.895 2.306 2.365 1.833 1.860arrow_forwardThe director of research and development is testing a new drug. She wants to know if there is evidence at the 0.02 level that the drug stays in the system for more than 312 minutes. For a sample of 69 patients, the mean time the drug stayed in the system was 319 minutes. Assume the variance is known to be 400. Step 2 of 5 : Enter the value of the z test statistic. Round your answer to two decimal places.arrow_forwardanswer d)arrow_forward
arrow_back_ios
SEE MORE QUESTIONS
arrow_forward_ios
Recommended textbooks for you
- MATLAB: An Introduction with ApplicationsStatisticsISBN:9781119256830Author:Amos GilatPublisher:John Wiley & Sons Inc
 Probability and Statistics for Engineering and th...StatisticsISBN:9781305251809Author:Jay L. DevorePublisher:Cengage Learning
 Statistics for The Behavioral Sciences (MindTap C...StatisticsISBN:9781305504912Author:Frederick J Gravetter, Larry B. WallnauPublisher:Cengage Learning
  Elementary Statistics: Picturing the World (7th E...StatisticsISBN:9780134683416Author:Ron Larson, Betsy FarberPublisher:PEARSON
 The Basic Practice of StatisticsStatisticsISBN:9781319042578Author:David S. Moore, William I. Notz, Michael A. FlignerPublisher:W. H. Freeman
 Introduction to the Practice of StatisticsStatisticsISBN:9781319013387Author:David S. Moore, George P. McCabe, Bruce A. CraigPublisher:W. H. Freeman
MATLAB: An Introduction with Applications
Statistics
ISBN:9781119256830
Author:Amos Gilat
Publisher:John Wiley & Sons Inc
Probability and Statistics for Engineering and th...
Statistics
ISBN:9781305251809
Author:Jay L. Devore
Publisher:Cengage Learning
Statistics for The Behavioral Sciences (MindTap C...
Statistics
ISBN:9781305504912
Author:Frederick J Gravetter, Larry B. Wallnau
Publisher:Cengage Learning
Elementary Statistics: Picturing the World (7th E...
Statistics
ISBN:9780134683416
Author:Ron Larson, Betsy Farber
Publisher:PEARSON
The Basic Practice of Statistics
Statistics
ISBN:9781319042578
Author:David S. Moore, William I. Notz, Michael A. Fligner
Publisher:W. H. Freeman
Introduction to the Practice of Statistics
Statistics
ISBN:9781319013387
Author:David S. Moore, George P. McCabe, Bruce A. Craig
Publisher:W. H. Freeman