MATLAB: An Introduction with Applications
6th Edition
ISBN: 9781119256830
Author: Amos Gilat
Publisher: John Wiley & Sons Inc
expand_more
expand_more
format_list_bulleted
Concept explainers
Topic Video
Question

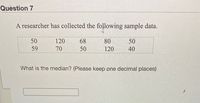
Transcribed Image Text:Question 7
A researcher has collected the following sample data.
50
120
68
80
50
59
70
50
120
40
What is the median? (Please keep one decimal places)
Expert Solution
arrow_forward
Step 1

Trending nowThis is a popular solution!
Step by stepSolved in 2 steps with 2 images

Knowledge Booster
Learn more about
Need a deep-dive on the concept behind this application? Look no further. Learn more about this topic, statistics and related others by exploring similar questions and additional content below.Similar questions
- The accompanying data set lists diastolic blood pressure measurements (mm Hg) of females. All of the values are even numbers. Construct a stemplot. Identify the two values that are closest to the middle when the data are sorted in order from lowest to highest. (These values are often used to find the median.) 84 86 76 84 74 60 72 775 70 68 66 68 64 84 94 92 62 76 66 68 66 76 68 80 72 Construct the stemplot.arrow_forwardFind the median for the given sample data. Listed below are the amounts of time (in months) that the employees of a restaurant have been working at the restaurant. Find the median. 12 3 7 8.5 12 15 17 38 60 77 99 127 135 167 O 59.0 months O 27.5 months 17 months 54.8 monthsarrow_forwardConsider the data set with 34 entries. 17 23 25 25 26 27 40 43 43 43 46 47 52 56 57 59 63 68 74 75 75 78 80 81 81 84 87 86 89 90 93 95 98 99 Find the sample standard deviation.arrow_forward
- We are going to calculate the mean, median, and mode for two sets of data. Please show your answer to one decimal place if necessary.Here is the first data set. 48 78 53 22 45 42 61 97 87 22 54 what is the mean (¯xx¯) of this data set? What is the median of this data set? What is the mode of this data set? Here is the second data set. 49 84 44 89 74 26 80 39 92 49 What is the mean (¯xx¯) of this data set? What is the median of this data set? What is the mode of this data set?arrow_forwardd) Create a 99% Confidence interval for the mean. Provide a sketch of the critical value and calculate the standard error. Only for this part use o = 23.8arrow_forwardFind the median for the following group of data items. 35, 32, 31, 30, 36, 33, 29, 31 The median is 31.5 (Type an integer or a decimal.) Carrow_forward
- The following refer to the following data set: 43 49 26 76 96 66 35 49 81 73 What is the mean (¯xx¯) of this data set?mean = (Please show your answer to one decimal place.)What is the median of this data set?median = What is the mode of this data set?mode =arrow_forwardThe following refer to the following data set: 20 28 44 92 64 48 68 43 86 43 What is the mean (7) of this data set? mean = (Please show your answer to one decimal place.) What is the median of this data set? median = %3D What is the mode of this data set? mode = %3Darrow_forwardThe top 16 winning scores for NFL games are listed below. Find the mean score. Video Tutorial: How to find the mean on a TI-84 72 54 52 54 70 51 56 58 58 52 51 63 51 48 52 61 A. 54 B. 57.1 C. 63.2 D. 56.4arrow_forward
- What fraction of the numbers in the data set is greater than the median? 10 12 14 16 16 16 16 16 21 25 27 39arrow_forwardHere is a set of sample data. 53 85 72 19 63 80 21 78 79 5 33 23 37 11 31 61 24 2 58 1 28 Base on the data above, identify the 5 number summaryarrow_forwardHere is a set of sample data. 43 75 64 40 50 11 91 99 44 82 39 25 35 86 60 2 27 83 45 65 1 93 88 10 Base on the data above, identify the 5 number summaryarrow_forward
arrow_back_ios
SEE MORE QUESTIONS
arrow_forward_ios
Recommended textbooks for you
 MATLAB: An Introduction with ApplicationsStatisticsISBN:9781119256830Author:Amos GilatPublisher:John Wiley & Sons Inc
 Probability and Statistics for Engineering and th...StatisticsISBN:9781305251809Author:Jay L. DevorePublisher:Cengage Learning
 Statistics for The Behavioral Sciences (MindTap C...StatisticsISBN:9781305504912Author:Frederick J Gravetter, Larry B. WallnauPublisher:Cengage Learning
 Elementary Statistics: Picturing the World (7th E...StatisticsISBN:9780134683416Author:Ron Larson, Betsy FarberPublisher:PEARSON
 The Basic Practice of StatisticsStatisticsISBN:9781319042578Author:David S. Moore, William I. Notz, Michael A. FlignerPublisher:W. H. Freeman
 Introduction to the Practice of StatisticsStatisticsISBN:9781319013387Author:David S. Moore, George P. McCabe, Bruce A. CraigPublisher:W. H. Freeman

MATLAB: An Introduction with Applications
Statistics
ISBN:9781119256830
Author:Amos Gilat
Publisher:John Wiley & Sons Inc

Probability and Statistics for Engineering and th...
Statistics
ISBN:9781305251809
Author:Jay L. Devore
Publisher:Cengage Learning

Statistics for The Behavioral Sciences (MindTap C...
Statistics
ISBN:9781305504912
Author:Frederick J Gravetter, Larry B. Wallnau
Publisher:Cengage Learning

Elementary Statistics: Picturing the World (7th E...
Statistics
ISBN:9780134683416
Author:Ron Larson, Betsy Farber
Publisher:PEARSON

The Basic Practice of Statistics
Statistics
ISBN:9781319042578
Author:David S. Moore, William I. Notz, Michael A. Fligner
Publisher:W. H. Freeman

Introduction to the Practice of Statistics
Statistics
ISBN:9781319013387
Author:David S. Moore, George P. McCabe, Bruce A. Craig
Publisher:W. H. Freeman