
Glencoe Algebra 1, Student Edition, 9780079039897, 0079039898, 2018
18th Edition
ISBN: 9780079039897
Author: Carter
Publisher: McGraw Hill
expand_more
expand_more
format_list_bulleted
Related questions
Question
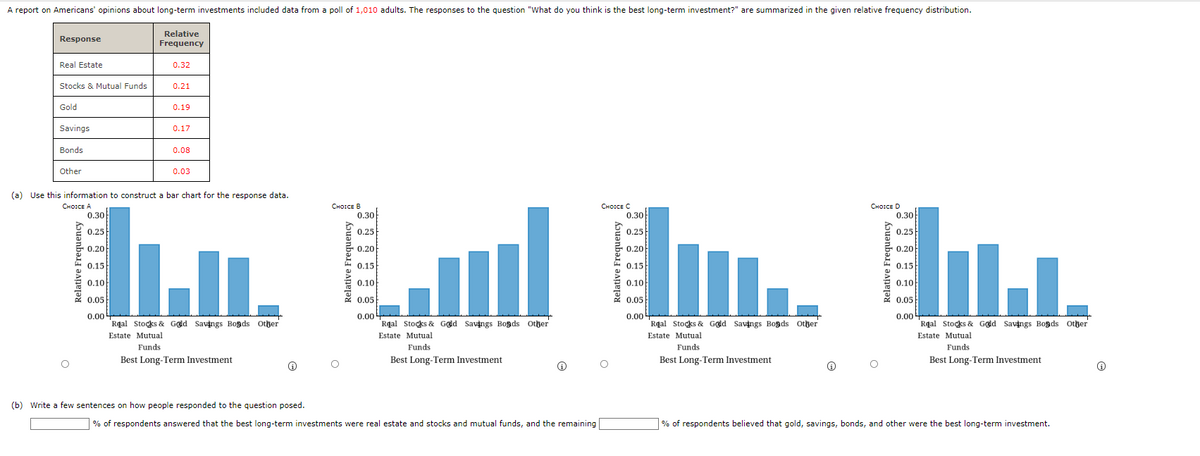

Transcribed Image Text:A report on Americans' opinions about long-term investments included data from a poll of 1,010 adults. The responses to the question "What do you think is the best long-term investment?" are summarized in the given relative frequency distribution.
Response
Real Estate
Stocks & Mutual Funds
Gold
Savings
Bonds
Other
Relative Frequency
0.30
0.25
0.20
0.15
0.10
Relative
Frequency
0.05
0.00
0.32
0.21
0.19
(a) Use this information to construct a bar chart for the response data.
CHOICE A
0.17
0.08
0.03
Funds
Best Long-Term Investment
CHOICE B
(b) Write a few sentences on how people responded to the question posed.
0.20
0.15
0.15
ko. Lul M. ha.
0.10
0.10
0.05
0.05
Real Stocks & Gold Savings Boads Other
Real Stocks & Gold Savings Boads Other
Real Stocks & Gold Savings Bonds Other
Real Stocks & Gold Savings Boads Other
Estate Mutual
Estate Mutual
Estate Mutual
Estate Mutual
Funds
Funds
Best Long-Term Investment
Best Long-Term Investment
O
0.30
0.25
0.00
Ⓒ
CHOICE C
% of respondents answered that the best long-term investments were real estate and stocks and mutual funds, and the remaining
0.30
0.25
0.20
0.15
0.10
0.05
0.00
CHOICE D
Ⓡ
0.30
0.25
0.20
0.00
Funds
Best Long-Term Investment
% of respondents believed that gold, savings, bonds, and other were the best long-term investment.
Ⓡ
Expert Solution
This question has been solved!
Explore an expertly crafted, step-by-step solution for a thorough understanding of key concepts.

This is a popular solution

Trending nowThis is a popular solution!

Step by stepSolved in 2 steps with 2 images

Knowledge Booster

Similar questions
- Suppose the Dow Jones Industrial Average went up 149.82 points. The following table shows the stock price changes for a sample of 12 companies on that day. PRICE CHANGE PRICE CHANGE COMPANY $ COMPANY $ AFLAC 0.81 JOHN&JOHN 1.46 BANK AMERICA 0.05 LOEWS CP 0.92 CABELVISION 0.41 NOKIA 0.21 DIAGEO 1.32 SMPRAENGY 0.97 FLOUR CP 2.37 SUNOCO 0.52 GOODRICH 0.4 TYSON FOOD 0.22 Provide 95% confidence interval estimates of the populatioin vairance and the population standard deviation.arrow_forwardPlease help on d and earrow_forwardAn article gave the following data on median worker pay (in thousands of dollars) and the 1-year percent change in stock price for the 13 highest paying companies in the United States. Percent Change in Stock Price Median Company Worker Pay Company 1 134.7 21.9 Company 2 132.2 92.4 Company 3 125.0 33.8 Company 4 122.8 52.3 Company 5 122.5 42.1 Company 6 121.2 2.6 Company 7 121.2 5.3 Company 8 119.0 29.9 Company 9 118.0 7.9 Company 10 118.0 37.2 Company 11 117.6 15.8 Company 12 117.4 21.9 Company 13 115.1 -44.5arrow_forward
- signment%202.pdf - A Read aloud Draw 5. According to the Ameriprise Financial Money Across Generations study, 9 out of 10 parents with adult children ages 20 to 35 have helped their adult children with some type of financial assistance ranging from college, a car, rent, utilities, credit card debt, and/or down payments for houses. The following table with sample data consistent with the study 2|Page shows the number of times parents have given their adult children financial assistance to buy a car and to pay rent. Pay Rent Yes No Buy a car Yes 583 529 No 169 788 a. Develop a joint probability table and use it to answer the remaining questions. b. If parents did not provide financial assistance to buy a car, what it the probability that the parents assisted with paying rent? C. Is financial assistance to buy a car independent of financial assistance to pay rent? Use probabilities to justify your answer.arrow_forwardBelow are listed several variables. Check ALL those that are QUANTITATIVE. Group of answer choices • The net profit for a company in 2000 • The dollar amounts on an accounts receivable invoice • The advertising medium (radio, tv, print) used to promote a product • The stock exchange (NASDAQ, NYSE, etc) on which a company’s stock is traded • The reason for termination for all ex-employeesarrow_forwardThe closing price of the Standard and Poor 500 Stock Covered Call Index is being recorded and put in a dataset each day. Suppose that the average index price is $2,447.93. If the distribution of the index price is left-skewed (e.g. in the plot below), will the median be larger, smaller, or approximately equal to $2,447.93? S&P 500 Index Price ($)arrow_forward
- A statistical program is recommended. Occasionally, it has been the case that home prices and mortgage rates dropped so low that in a number of cities the monthly cost of owning a home was less expensive than renting. The following data show the average asking rent for 10 markets and the monthly mortgage on the median priced home (including taxes and insurance) for 10 cities where the average monthly mortgage payment was less than the average asking rent. City Rent ($) Mortgage ($) A 840 539 B 1,062 1,002 C 823 628 D 779 713 E 796 655 F 1,071 975 G 953 776 H 851 695 I 762 651 J 723 654 Develop the estimated regression equation that can be used to predict the monthly mortgage given the average asking rent. (Round your numerical values to three decimal places.) ŷ = c.) Do the assumptions about the error term and model form seem reasonable in light of the residual plot? The plot suggests curvature in the residuals indicating that the assumption of a linear relationship between the…arrow_forwardPredict the lung cancer index for men who worked in an occupation in England in which the smoking index was 129. What type of prediction did you just make? Explain What type of prediction did you just make? Explain arrow_forwardMetro Area Jobless Rate (%) Atlanta 7.1 Boston 5.2 Charlotte 4.3 Chicago 4.7 Dallas 5.8 Denver 5.8 Detroit 4.2 Houston 3.2 Jacksonville 7.3 Las Vegas 7.6 Los Angeles 5.3 Miami 4.2 Minneapolis 6.3 Nashville 6.6 New York 6.2 Orange County 7.9 Orlando 7.0 Philadelphia 6.2 Phoenix 4.2 Portland 6.5 Raleigh 5.7 Sacramento 3.5 St. Louis 7.5 San Diego 4.9 San Francisco 6.8 Seattle 4.3 Tampa 7.5 A.What is the upper limit of the point estimate at 95%? The answer is . (Make sure one decimal place.) B.What is the lower limit of the pointe estimate at 95%? The answer is . (Make sure one decimal place.)arrow_forward
- Sunshine Kleebler Nabisco Private Times Displayed = 424 350 1120 325 TimesDis. I bought= 70 43 652 104 Percentage= .165094 .122857 .582143 .32 Correlation = ? ? ? ?arrow_forwardWhich of the following variables is considered to be qualitative? method of payment (e.g., cash or credit card) O annual sales O price agearrow_forwardHours Spent in Child Care 7.5 1.8 0.9 8.0 5.2 6.1 3.3 1.0 4.4 1.6 5.2 11.5 11.6 10.1 9.0 7.3 2.2 1.0 5.2 10.7 7.6 4.1 10.1 6.0 10.1 9.9 10.4 7.0 3.8 9.6 4.1 7.2 4.0 8.5 6.0 7.3 5.4 11.5 9.1 6.5arrow_forward
arrow_back_ios
SEE MORE QUESTIONS
arrow_forward_ios
Recommended textbooks for you
- Glencoe Algebra 1, Student Edition, 9780079039897...AlgebraISBN:9780079039897Author:CarterPublisher:McGraw Hill
 Big Ideas Math A Bridge To Success Algebra 1: Stu...AlgebraISBN:9781680331141Author:HOUGHTON MIFFLIN HARCOURTPublisher:Houghton Mifflin Harcourt
Glencoe Algebra 1, Student Edition, 9780079039897...
Algebra
ISBN:9780079039897
Author:Carter
Publisher:McGraw Hill
Big Ideas Math A Bridge To Success Algebra 1: Stu...
Algebra
ISBN:9781680331141
Author:HOUGHTON MIFFLIN HARCOURT
Publisher:Houghton Mifflin Harcourt