MATLAB: An Introduction with Applications
6th Edition
ISBN: 9781119256830
Author: Amos Gilat
Publisher: John Wiley & Sons Inc
expand_more
expand_more
format_list_bulleted
Question
thumb_up100%
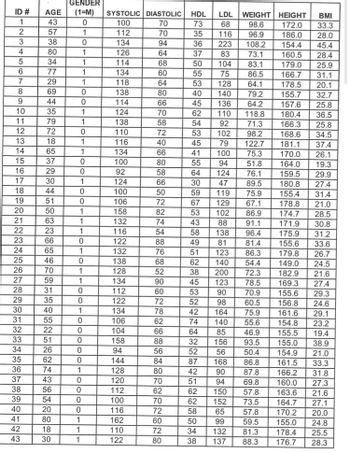
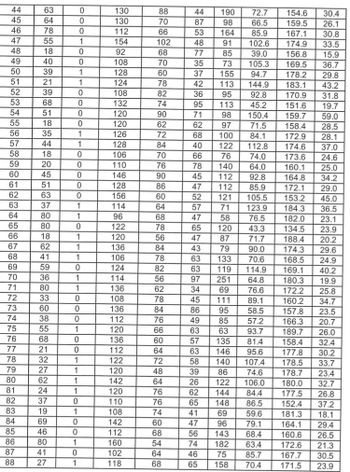
1. What is the mean BMI of this population?
2. How do these adults’ BMI value stack up against the rest of the country?
3. Nationally, 47% of adults in the US have hypertension (see the CDC article for more
details). Does this population have a significantly lower percentage of adults with
hypertension? Use 0.01.

Transcribed Image Text:ID #
1
2
3
4
5
6
7
8
9
10
11
12
13
14
15
16
17
18
19
20
21
22
23
24
25
26
27
28
29
30
31
32
33
34
35
36
37
38
39
40
41
42
43
AGE
43
57
38
80
34
77
29
69
44
35
79
72
18
65
37
29
30
44
51
50
63
23
66
65
46
70
59
31
35
40
55
22
51
26
62
74
43
56
54
20
80
18
30
GENDER
(1=M)
0
1
0
1
1
1
1
0
0
0
1
0
0
1
1
0
1
1
0
1
1
1
0
1
0
1
1
0
0
1
0
0
0
0
0
1
0
0
0
0
1
1
1
SYSTOLIC DIASTOLIC HDL LDL WEIGHT
100
70
73
68
98.6
70
35
116 96.9
36 223 108.2
37
83
73.1
50 104 83.1
55
75
86.5
53 128
64.1
40
140
79.2
136 64.2
157.6
110 118.8
180.4
92
71.3
166.3
102
98.2 168.6
79 122.7 181.1
100
75.3 170.0
94
51.8
164.0
64
124
76.1
159.5
30
47
89.5
180.8
59
119
75.9
155.4
67 129 67.1
53 102
86.9
43
88
91.1
58
96.4
49
81.4
51 123
86.3
62
140 54.4
38
200 72.3
45 123
78.5
53
90
70.9
52
98
60.5
42
164
75.9
74 140
55.6
85
46.9
156
93.5
56
50.4
87 168
86.8
42
90
87.8
51
94
69.8
62
150
57.8
62
152
73.5
58
65
57.8
50
99
59.5
34 132
81.3
178.4
38 137 88.3 176.7
112
134
126
114
134
118
138
114
124
138
110
116
134
100
92
124
100
106
158
132
116
122
132
138
128
134
112
122
134
106
104
158
94
144
128
120
112
100
116
162
110
122
94
64
68
60
64
80
66
70
58
72
40
66
80
58
66
50
72
82
74
54
88
76
68
52
90
60
72
78
62
66
88
56
84
80
70
62
70
72
60
72
80
45
62
54
53
45
41
55
64
32
52
138
81
HEIGHT
BMI
172.0 33.3
186.0
154.4
160.5
179.0
166.7
178.5
155.7
178.8
174.7
28.0
45.4
28.4
25.9
31.1
20.1
32.7
25.8
36.5
25.8
34.5
37.4
26.1
19.3
29.9
27.4
31.4
21.0
28.5
171.9
30.8
175.9
31.2
155.6 33.6
179.8
26.7
149.0
24.5
182.9
21.6
169.3
27.4
155.6
29.3
156.8
24.6
161.6
29.1
154.8
23.2
155.5
19.4
155.0
154.9
161.5
166.2
160.0
163.6
164.7
170.2
155.0
38.9
21.0
33.3
31.8
27.3
21.6
27.1
20.0
24.8
25.5
28.3

Transcribed Image Text:44
45
46
47
48
49
50
51
52
53
54
55
56
57
58
59
60
61
62
63
64
65
66
67
68
69
70
71
72
73
74
75
76
77
78
79
80
81
82
83
84
85
86
87
88
63
64
78
55
18
40
39
21
39
68
51
18
35
44
18
20
45
51
63
37
80
80
18
62
41
59
36
80
33
60
38
55
68
21
32
27
62
24
37
19
69
46
80
41
27
0
0
1
1
0
1
1
1
0
0
0
1
1
1
1
0
0
0
1
1
0
0
0
1
0
0
1
1
0
1
0
0
1
0
0
1
1
0
0
0
0
0
1
0
1
130
130
112
154
92
108
128
124
108
132
120
120
126
128
106
110
146
128
156
114
96
122
120
136
106
124
114
136
108
136
112
120
136
112
122
120
142
120
110
108
142
112
160
102
118
88
70
66
102
68
70
60
78
82
74
90
62
72
84
70
76
90
86
60
64
68
78
56
84
78
82
56
62
78
84
76
66
60
64
72
48
64
76
76
74
60
68
54
64
68
44 190
87
98
53 164
48
77
35
91 102.6
85
39.0
73
105.3
37 155
94.7
42 113 144.9
36
95
31.8
95 113
19.7
71
98 150.4
59.0
62
97
71.5
28.5
68 100 84.1
172.9
28.1
40
122
174.6
37.0
76
173.6
24.6
140 64.0
160.1
25.0
112
92.8
164.8
34.2
112
85.9
172.1 29.0
121
105.5
153.2
45.0
71 123.9
184.3
58
76.5
182.0
120 43.3
134.5
87
71.7
188.4
79
90.0
174.3
133
70.6
168.5
119
114.9
169.1
251
64.8
180.3
69
76.6
172.2
111
89.1
160.2
95
58.5
157.8
85 57.2
166.3
63
93.7
189.7
135
81.4
158.4
146 95.6 177.8
178.5
178.7
180.0 32.7
177.5
152.4
181.3
66
78
45
47
52
57
47
65
47
43
63
63
97
34
45
86
49
72.7
154.6
30.4
66.5 159.5 26.1
85.9 167.1 30.8
174.9 33.5
156.8
15.9
169.5 36.7
178.2
29.8
183.1
43.2
170.9
151.6
159.7
158.4
148
69
96
92.8
45.2
112.8
74.0
63
57
63
58 140 107.4
39
86
74.6
26
122 106.0
62
144
84.4
65
86.5
41
59.6
47
79.1
56 143 68.4
74 182 63.4
46
75
85.7
65 158
70.4
36.5
23.1
23.9
20.2
29.6
24.9
40.2
19.9
25.8
34.7
23.5
20.7
26.0
32.4
30.2
33.7
23.4
26.8
37.2
18.1
164.1
29.4
160.6
26.5
172.6 21.3
167.7
30.5
171.5
23.9
Expert Solution
This question has been solved!
Explore an expertly crafted, step-by-step solution for a thorough understanding of key concepts.
This is a popular solution
Trending nowThis is a popular solution!
Step by stepSolved in 4 steps

Knowledge Booster
Similar questions
- In psychology, what are two factors that decrease statistical power?arrow_forwardPlease help answering this one:arrow_forwardThe 2018 General Social Survey contains information on the number of poor mental health days adults in the US had in the last month. The data are below. Calculate the standard error of the mean number of poor mental health days for males. Table 1. Mean number of poor mental health days in the last 30 days by sex Male Female Total Mean 3.02 3.55 6.78 1408 4.06 S.D 6.43 7.07 678 730 Source GSS 2018 F6 F7 F8 F9 F10 F11 F12 FS & 8. 9. 6 de5arrow_forward
- Katie is studying aggression among adolescent girls. She believes that there is a relationship between the level of interaction a girl has with her mother and the level of aggression. She has identified 5 girls who fall into each of 4 interaction level and has measured their aggression scores. Her data are given below. Complete table below by filling in boxes with correct value. Show calculation. No Low Moderate High interaction interaction interaction interaction A, A A1 A2 A3 A4 4 16 4 16 4 16 25 36 4 16 4 16 36 25 3 4 16 36 4 16 25 3. 5 25 25 4 16 3 9 Σ Α82 n2=5; n3=5; n4=5; N= O; X = D; X;=4.80; X 3=4.00; X 4=3.40 Σ Α-26 Σ Α-138 Σ Α Σ Α-118 Σ A-20 Σ Α-17 ΣΑ ; ΣΑΟ397; ni- totarrow_forwardYou collect information on a random sample of women and obtain estimates on vitamin D exposure. However, the results that you find are different than those conducted at another study site. Should you be concerned? Explain your answer using the concept of sampling variabilityarrow_forwarda. Develop a hypothesis test that can be used to determine whether the mean annual consumption in Webster City is higher than the national mean. Ho: $21.5 Ha: >21.5 b. What is a point estimate of the difference between mean annual consumption in Webster City and the national mean? (2 decimals) c. At a = 0.01, test for a significant difference by completing the following. Calculate the value of the test statistic (2 decimals). The p-value is Reject the null hypothesis? (4 decimals) Yes v What is your conclusion? Conclude the population mean consumption of milk in Webster City is greater thaarrow_forward
- Using the same data and information. Please answer this: Should you be encouraging or discouraging credit card sales? In answering this question, consider the following: Is the proportion of credit and non-credit sales significantly different? (a=.05) Is the average sale amount for credit sales different than the average sales amount for non-credit sales? (a=.05)arrow_forwardstate health web site provides information on the cost-to-charge ratio (the percentage of billed charges that are actual costs to the hospital). The cost-to-charge ratios for both inpatient and outpatient care in 2002 for a sample of six hospitals of that state follow. (Use a statistical computer package to calculate the P-value. Use ?inpatient − ?outpatient. Round your test statistic to two decimal places and your P-value to three decimal places.) Hospital 2002InpatientRatio 2002OutpatientRatio 1 86 78 2 77 58 3 99 77 4 65 57 5 65 50 6 104 69 t = df = P-value = Is there sufficient evidence to suggest that the mean difference cost-to-charge ratio for the state's hospitals is lower for outpatient care than for inpatient care? Use a significance level of 0.05. Yes OR Noarrow_forwardExplain your reasoning behind your choice please and thank youarrow_forward
- 2. Explain the relationship between the population mean ?, the sample mean?̅, and a value of the sample mean ?̅. Which is the population parameter,which is a statistic, which is a point estimate, and which is an estimator?arrow_forwardThe 2018 General Social Survey contains information on the number of 1F poor mental health days adults in the US had in the last month. The data arę below. Calculate the standard error of the mean number of poor health days for females. Table 1. Mean number of poor mental health days in the last 30 days by sex Male Female Total Mean S.D. 3.55 6.78 1408 3.02 4.06 6.43 7.07 678 730 Source GSS 2018 Your answerarrow_forward
arrow_back_ios
arrow_forward_ios
Recommended textbooks for you
 MATLAB: An Introduction with ApplicationsStatisticsISBN:9781119256830Author:Amos GilatPublisher:John Wiley & Sons Inc
 Probability and Statistics for Engineering and th...StatisticsISBN:9781305251809Author:Jay L. DevorePublisher:Cengage Learning
 Statistics for The Behavioral Sciences (MindTap C...StatisticsISBN:9781305504912Author:Frederick J Gravetter, Larry B. WallnauPublisher:Cengage Learning
 Elementary Statistics: Picturing the World (7th E...StatisticsISBN:9780134683416Author:Ron Larson, Betsy FarberPublisher:PEARSON
 The Basic Practice of StatisticsStatisticsISBN:9781319042578Author:David S. Moore, William I. Notz, Michael A. FlignerPublisher:W. H. Freeman
 Introduction to the Practice of StatisticsStatisticsISBN:9781319013387Author:David S. Moore, George P. McCabe, Bruce A. CraigPublisher:W. H. Freeman

MATLAB: An Introduction with Applications
Statistics
ISBN:9781119256830
Author:Amos Gilat
Publisher:John Wiley & Sons Inc

Probability and Statistics for Engineering and th...
Statistics
ISBN:9781305251809
Author:Jay L. Devore
Publisher:Cengage Learning

Statistics for The Behavioral Sciences (MindTap C...
Statistics
ISBN:9781305504912
Author:Frederick J Gravetter, Larry B. Wallnau
Publisher:Cengage Learning

Elementary Statistics: Picturing the World (7th E...
Statistics
ISBN:9780134683416
Author:Ron Larson, Betsy Farber
Publisher:PEARSON

The Basic Practice of Statistics
Statistics
ISBN:9781319042578
Author:David S. Moore, William I. Notz, Michael A. Fligner
Publisher:W. H. Freeman

Introduction to the Practice of Statistics
Statistics
ISBN:9781319013387
Author:David S. Moore, George P. McCabe, Bruce A. Craig
Publisher:W. H. Freeman