Calculus: Early Transcendentals
8th Edition
ISBN: 9781285741550
Author: James Stewart
Publisher: Cengage Learning
expand_more
expand_more
format_list_bulleted
Question

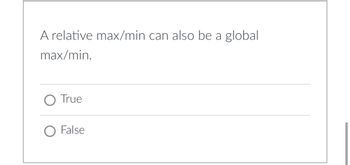
Transcribed Image Text:A relative max/min can also be a global
max/min.
O True
O False
Expert Solution
This question has been solved!
Explore an expertly crafted, step-by-step solution for a thorough understanding of key concepts.
Step by stepSolved in 2 steps

Knowledge Booster
Similar questions
- Paresarrow_forwardA car manufacturer company shares the data of its one of the brands in 1086cc category during 2003 to 2009. The data listed in Table No.3. Table 3. The number of sales of a car in 1086cc category Year No. 1 Sales 3| 4 | 5 | 6| 7 | 3135 | 6922 | 7009| 7031| 3470| 2227| 404 2 (a) Let you are working in the data processing unit of this company. Compare years and sales by using suitable graphing technique and suggests why the company should make some changes in this product otherwise the company should discontinue the production of this model. (b) Apply a statistical technique that quantifies the relationship between the number of years and corresponding sales. Interpret the results that you obtained through statistical technique to justify your explanation.arrow_forwardPlease fully answer correctlyarrow_forward
- USE DESCRIPTIVE STATS A report shows that Covid-19 reduced household expenditure in Europe by 8% in 2020. Elsewhere, consumer spending also dropped significantly in 2020, with 4% seen in the United States, and 17% reported in China (Broom, 2021).After reading the report, Mr. Goh, a student of Singapore University of Social Sciences, was interested to find out how Covid-19 has affected the household spending in Singapore. Surprisingly, he found news saying that consumer spending among Singapore residents was resilient and at a similar level to 2019 (Choo, 2021).In order to have a better understanding of the impact of Covid-19 on household spending of Singapore residents, Mr. Goh decided to conduct a survey. He got a random sample of 32 students from Singapore University of Social Sciences, and collected data on their average monthly household expenditure in 2019 and 2020. Based on his own experience, he hypothesised that the household expenditure of Singapore residents in 2020 is lower…arrow_forwardTyped plzarrow_forwardComputer-Aided Drawing PERFORMANC TAS A house designer uses computer-aided drawings to illustrate new houses. She likes to show her drawings to clients on a large screen. She often uses the zoom-in function to enlarge the drawings so that clients can see certain features better. Each click of the zoom-in button results in a 10 percent increase in the size of a drawing. (a) On a certain drawing of a house, the width of the front door is 3 inches on screen, using the default settings. Make a table of values to show the width of the door on screen after each of the first four clicks of the zoom-in button. These values should be accurate to the thousandths place, (b) Write an algebraic rule for the function that will give the display size of the door for any number of clicks.arrow_forward
- Data in the table comes from the NASA Global Climate Change website. It gives the average globaltemperature, in Celsius, for the given year. Use both rows for your calculations. For this problem, youwill see how well year correlates with the average temperature. Let ? be the number of years since1984 and ? be the average global temperature in degrees Celsius.Year 1984 1986 1988 1990 1992 1994 1996 1998 2000Temp 0.16 0.18 0.38 0.45 0.22 0.31 0.33 0.61 0.40Year 2002 2004 2006 2008 2010 2012 2014 2016 2018Temp 0.63 0.54 0.64 0.54 0.72 0.64 0.75 1.02 0.85a. Make a scatterplot of the data. Being sure to clearly label each axis. Keep in mind howeach variable is defined. Based on this scatterplot, is a linear model reasonable for this data set?Briefly explain.b. Determine the correlation coefficient for this data. Interpret this value in context.c. Determine the coefficient of determination for this data. Interpret this value incontext.d.State the regression line for the data.e. What does the…arrow_forwardIf Study determines the difference an average salaries are so population of people with blue eyes and people with brown eyes is not significant than a population of blue are people in brown and people are ______ different salaries.arrow_forwardIn regression analysis if a point has leverage then it must also be influential a true b falsearrow_forward
arrow_back_ios
SEE MORE QUESTIONS
arrow_forward_ios
Recommended textbooks for you
 Calculus: Early TranscendentalsCalculusISBN:9781285741550Author:James StewartPublisher:Cengage Learning
 Thomas' Calculus (14th Edition)CalculusISBN:9780134438986Author:Joel R. Hass, Christopher E. Heil, Maurice D. WeirPublisher:PEARSON
 Calculus: Early Transcendentals (3rd Edition)CalculusISBN:9780134763644Author:William L. Briggs, Lyle Cochran, Bernard Gillett, Eric SchulzPublisher:PEARSON
 Calculus: Early TranscendentalsCalculusISBN:9781319050740Author:Jon Rogawski, Colin Adams, Robert FranzosaPublisher:W. H. Freeman
 Calculus: Early Transcendental FunctionsCalculusISBN:9781337552516Author:Ron Larson, Bruce H. EdwardsPublisher:Cengage Learning

Calculus: Early Transcendentals
Calculus
ISBN:9781285741550
Author:James Stewart
Publisher:Cengage Learning

Thomas' Calculus (14th Edition)
Calculus
ISBN:9780134438986
Author:Joel R. Hass, Christopher E. Heil, Maurice D. Weir
Publisher:PEARSON

Calculus: Early Transcendentals (3rd Edition)
Calculus
ISBN:9780134763644
Author:William L. Briggs, Lyle Cochran, Bernard Gillett, Eric Schulz
Publisher:PEARSON

Calculus: Early Transcendentals
Calculus
ISBN:9781319050740
Author:Jon Rogawski, Colin Adams, Robert Franzosa
Publisher:W. H. Freeman


Calculus: Early Transcendental Functions
Calculus
ISBN:9781337552516
Author:Ron Larson, Bruce H. Edwards
Publisher:Cengage Learning