MATLAB: An Introduction with Applications
6th Edition
ISBN: 9781119256830
Author: Amos Gilat
Publisher: John Wiley & Sons Inc
expand_more
expand_more
format_list_bulleted
Question

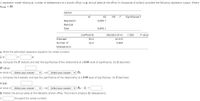
Transcribed Image Text:A regression model relating a, number of salespersons at a branch office, to y, annual sales at the office (in thousands of dollars) provided the following regression output. Where
ntotal = 32,
ANOVA
df
MS
F
Significance F
Regression
6,665.7
Residual
Total
8,845.1
Coefficients
Standard Error
t Stat
P-value
Intercept
83.0
10.915
Number of
42.0
5.864
Salespersons
a. Write the estimated regression equation (to whole number).
b. Compute the F statistic and test the significance of the relationship at a 0.05 level of significance. (to 2 decimals)
F-value
p-value is
c. Compute the t statistic and test the significance of the relationship at a 0.05 level of significance. (to 2 decimals)
Select your answer
, we
Select your answer - v Họ
t Stat
p-value is
Select your answer -
, we
Select your answer - v Ho: B, =
d. Predict the annual sales at the Memphis branch office. This branch employs 11 salespersons.
$
thousand (to whole number)

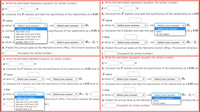
Transcribed Image Text:a. Write the estimated regression equation (to whole number).
a. Write the estimated regression equation (to whole number).
ŷ =
ŷ =
b. Compute the F statistic and test the significance of the relationship at a 0.05 b. Compute the F statistic and test the significance of the relationship at a 0.0
F-value
F-value
p-value is- Select your answer-
p-value is - select your answer -
J, we - Select your answer-
|Ho
, we - Select your answer -
significance of the relationship at a 0.05 le c. Compute the t statistic and test the sign reject
|Ho
- Select your answer
- Select your answer
c. Comput less than 0.01
pat a 0.05
do not reject
between 0.01 and 0.025
between 0.025 and 0.05
between 0.05 and 0.10
t Stat
t Stat
p-value is 9reater than 0.1O
we - Select your answer - v Ho: B1 = p-value is - Select your answer-
Select your answer - v Ho: B,
d. Predict the annual sales at the Memphis branch office. This branch employs 11 d. Predict the annual sales at the Memphis branch office. This branch employs
thousand (to whole number)
thousand (to whole number)
a. Write the estimated regression equation (to whole number).
a. Write the estimated regression equation (to whole number).
ŷ =
b. Compute the F statistic and test the significance of the relationship at a 0.05 level of b. Compute the F statistic and test the significance of the relationship at a 0.05 lev
F-value
F-value
p-value is- Select your answer
-
we - Select your answer-
| Ho
v, we - Select your answer-
| Ho
p-value is - Select your answer-
c. Compute thet statistic and test the significance of the relationship at a 0.05 level ofs c. Compute the t statistic and test the significance of the relationship at a 0.05 leve
t Stat
t Stat
p-value is- Select your answer
- Select your answer-
we - Select your answer - v Họ: B, =
p-value is - Select your answer-
v Ho : B1 =
we-Select your answer-
- Select your answer
d. Predict less than 0.01
nphis branch office. This branch employs 1l salesp d. Predict the annual sales at the Memphis reject
employs 11 sa
between 0.01 and 0.025
between 0.025 and 0.05
between 0.05 and 0.10
do not reject
ber)
thousand (to whole number)
greater than 0.10
Expert Solution
This question has been solved!
Explore an expertly crafted, step-by-step solution for a thorough understanding of key concepts.
This is a popular solution
Trending nowThis is a popular solution!
Step by stepSolved in 3 steps with 2 images

Knowledge Booster
Similar questions
- A sales manager for an advertising agency believes there is a relationship between the number of contacts that a salesperson makes and the amount of sales dollars earned. A regression analysis shows the following results. Coefficients Standard Error t-Stat p-value Intercept -12.201 6.560 -1.860 0.100 Number of contacts 2.195 0.176 12.505 0.000 ANOVA df SS MS F Significance F Regression 1.00 |13,555.42 |13,555.42 156.38 0.00 Residual 8.00 693.48 86.68 Total 9.00 14,248.90 Assume that X = 33.4 and E(X – X) 2814.4. Rounding to one decimal place, the 95% confidence interval for 30 calls isarrow_forwardA regression model relating x, number of salespersons at a branch office, to y, annual sales at the office (in thousands of dollars) provided the following regression output. Where ntotal = 40. ANOVA df SS MS F Significance F Regression 6,759.5 Residual Total 9,031.4 Coefficients Standard Error t Stat P-value Intercept 75.0 10.408 Number of 40.0 5.323 Salespersons a. Write the estimated regression equation (to whole number). ŷ = + b. Compute the F statistic and test the significance of the relationship at a 0.05 level of significance. (to 2 decimals) F-value p-value is - Select your answer - we - Select your answer - v Ho c. Compute the t statistic and test the significance of the relationship at a 0.05 level of significance. (to 2 decimals) t Stat p-value is - Select your answer - we - Select your answer - v Ho: B, d. Predict the annual sales at the Memphis branch office. This branch employs 10 salespersons. $ thousand (to whole number) %24arrow_forwardA student used multiple regression analysis to study how family spending (y) is influenced by income (x) family size (x2), and addition to savings(x3). The variables y, x1, and x3. The variables y, x1, and x3 are measured in thousands of dollars . The following results were obtained. ANOVA df SS Regression 3 45.9634 Residual 11 2.6218 Total Coefficient Standard Error Intercept 0.0136 X1 0.7992 0.074 X2 0.2280 0.190 X3 -0.5796 0.920 Write out the estimated regression equation for the relationship between the variables. Compute coefficient of determination. What can you say about the strength of this relationship? Carry out a test to determine whether y is significantly related to the independent variables. Use a 5% level of significant. Carry out a test to see if X3 and y are significantly related. Use a 5% level of significancearrow_forward
- Define Residuals or errors in Alternative Regression Models?arrow_forwardWaterbury Insurance Company wants to study the relationship between the amount of fire damage and the distance between the burning house and the neorest fire station. This information will be used in setting rates for insurance coverage. For o somple of 30 claims for the last year, the director of the actuarial department determined the distance from the fire station (x) and the amount of fire domage, in thousands of dollars (y). ANOVA table Source Regression Residual SS df MS F 1,870.5782 1,870.5782 41.39 1,265.4934 3,136.0716 28 45.1962 Total 29 Regression output Standard Variables Coefficients Error t(df-28) Intercept Distance-X 13.76815 3.106 2.914 3.77es e. 5861 6.43 Click here for the Excel Data File a-1. Determine the regression equation. (Round your answers to 3 decimal places.) y3D X. a-2 Is there a direct or indirect relotionship between the distance from the fire station and the amount of fire damage? The relationship between distance and damage is b. How much domage would…arrow_forwardPlease answer... I'm needed only 1 hours time to dd .... Thank uarrow_forward
- Which of the following tools is not appropriate for studying the relationship between two numerica variables? Correlation coefficient Scatter plot Historam Regressionarrow_forwardA student used multiple regression analysis to study how family spending (y) is influenced by income (x1), family size (x2), and additions to savings(x3). The variables y, x1, and x3 are measured in thousands of dollars. The following results were obtained. ANOVA df SS Regression 3 45.9634 Residual 11 2.6218 Total Coefficients Standard Error Intercept 0.0136 x1 0.7992 0.074 x2 0.2280 0.190 x3 -0.5796 0.920 Write out the estimated regression equation for the relationship between the variables. Compute coefficient of determination. What can you say about the strength of this relationship? Carry out a test to determine whether y is…arrow_forwardplease please answer fast please please answer super super fastarrow_forward
arrow_back_ios
arrow_forward_ios
Recommended textbooks for you
 MATLAB: An Introduction with ApplicationsStatisticsISBN:9781119256830Author:Amos GilatPublisher:John Wiley & Sons Inc
 Probability and Statistics for Engineering and th...StatisticsISBN:9781305251809Author:Jay L. DevorePublisher:Cengage Learning
 Statistics for The Behavioral Sciences (MindTap C...StatisticsISBN:9781305504912Author:Frederick J Gravetter, Larry B. WallnauPublisher:Cengage Learning
 Elementary Statistics: Picturing the World (7th E...StatisticsISBN:9780134683416Author:Ron Larson, Betsy FarberPublisher:PEARSON
 The Basic Practice of StatisticsStatisticsISBN:9781319042578Author:David S. Moore, William I. Notz, Michael A. FlignerPublisher:W. H. Freeman
 Introduction to the Practice of StatisticsStatisticsISBN:9781319013387Author:David S. Moore, George P. McCabe, Bruce A. CraigPublisher:W. H. Freeman

MATLAB: An Introduction with Applications
Statistics
ISBN:9781119256830
Author:Amos Gilat
Publisher:John Wiley & Sons Inc

Probability and Statistics for Engineering and th...
Statistics
ISBN:9781305251809
Author:Jay L. Devore
Publisher:Cengage Learning

Statistics for The Behavioral Sciences (MindTap C...
Statistics
ISBN:9781305504912
Author:Frederick J Gravetter, Larry B. Wallnau
Publisher:Cengage Learning

Elementary Statistics: Picturing the World (7th E...
Statistics
ISBN:9780134683416
Author:Ron Larson, Betsy Farber
Publisher:PEARSON

The Basic Practice of Statistics
Statistics
ISBN:9781319042578
Author:David S. Moore, William I. Notz, Michael A. Fligner
Publisher:W. H. Freeman

Introduction to the Practice of Statistics
Statistics
ISBN:9781319013387
Author:David S. Moore, George P. McCabe, Bruce A. Craig
Publisher:W. H. Freeman