
MATLAB: An Introduction with Applications
6th Edition
ISBN: 9781119256830
Author: Amos Gilat
Publisher: John Wiley & Sons Inc
expand_more
expand_more
format_list_bulleted
Related questions
Concept explainers
Topic Video
Question
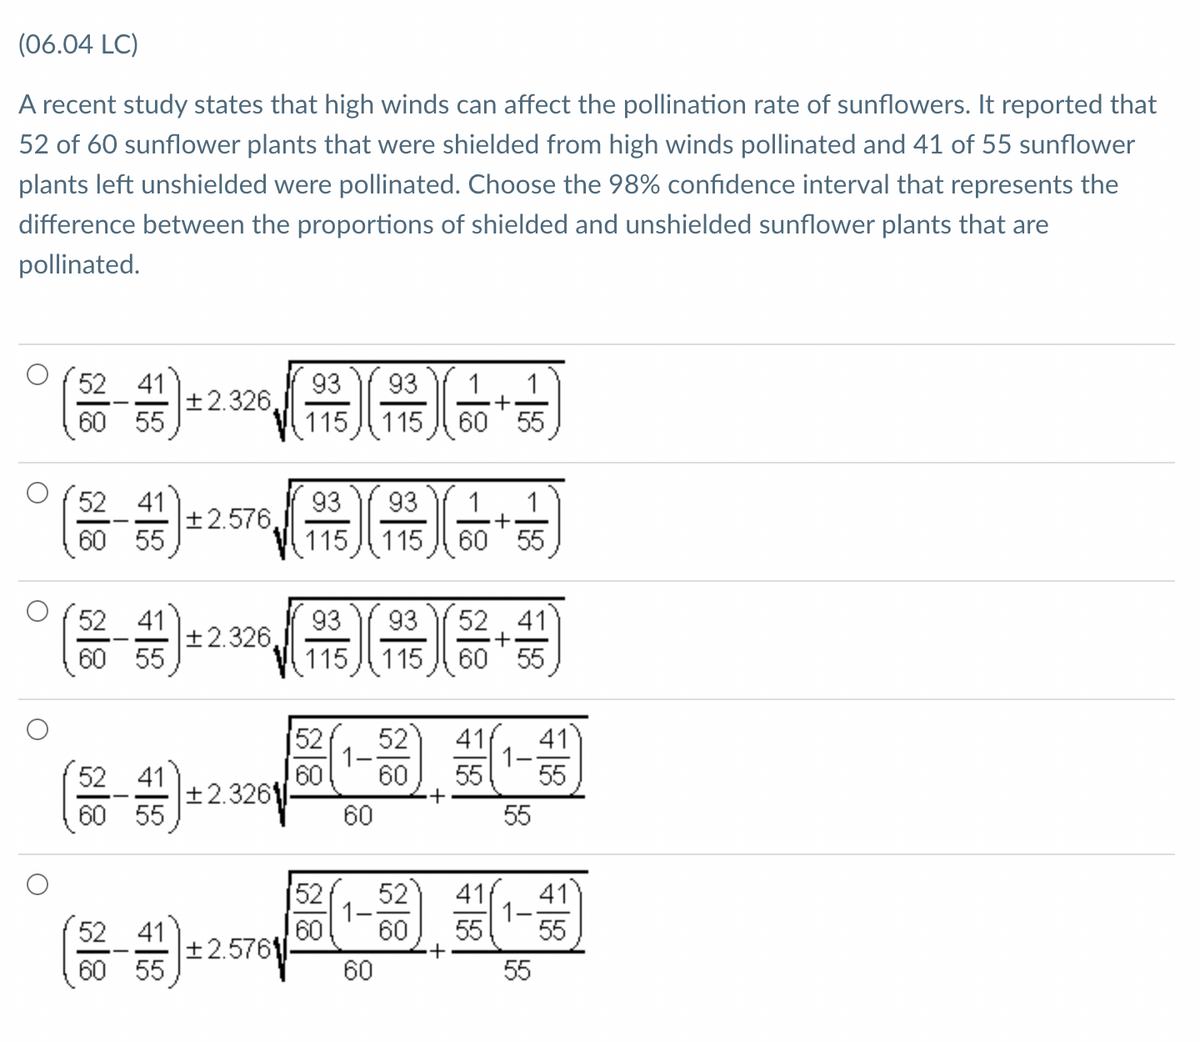

Transcribed Image Text:(06.04 LC)
A recent study states that high winds can affect the pollination rate of sunflowers. It reported that
52 of 60 sunflower plants that were shielded from high winds pollinated and 41 of 55 sunflower
plants left unshielded were pollinated. Choose the 98% confidence interval that represents the
difference between the proportions of shielded and unshielded sunflower plants that are
pollinated.
52 41
93
±2.326,
93
60 55
115 115
60 55
52 41
93
±2.576,
93
1
1
60 55
115
115
60 55
52. 41
+
60 55
52 41
93
|±2.326,
93
60 55
115115
41
1-
55
52
52
41
1-
60
60
55
52 41
|±2.326||
60 55
60
55
52
52
41
41
1-
55
1-
52 41
60
60
55
|±2.5761|-
60 55
60
55
Expert Solution
This question has been solved!
Explore an expertly crafted, step-by-step solution for a thorough understanding of key concepts.

This is a popular solution

Trending nowThis is a popular solution!

Step by stepSolved in 2 steps

Knowledge Booster


Learn more about
Need a deep-dive on the concept behind this application? Look no further. Learn more about this topic, statistics and related others by exploring similar questions and additional content below.Similar questions
- a simple random sample of 9 college freshmen were asked how many hour of sleep they typically got per night. The results were 8.5,6.5,8,9,6,7.5,24,8.5,9.5. Elminate the outlier, then consturct a 90% confidence interval for the mean amount of sleep from the remaining values.arrow_forwardA random sample of n₁ = 261 people who live in a city were selected and 107 identified as a "dog person." A random sample of n2 = 107 people who live in a rural area were selected and 62 identified as a "dog person." Find the 99% confidence interval for the difference in the proportion of people that live in a city who identify as a "dog person" and the proportion of people that live in a rural area who identify as a "dog person." Round answers to to 4 decimal places. P1-P2< Question Help: Message instructor Submit Questionarrow_forwardA random sample of n₁ = 217 people who live in a city were selected and 106 identified as a "dog person." A random sample of n₂ = 114 people who live in a rural area were selected and 66 identified as a "dog person." Find the 90% confidence interval for the difference in the proportion of people that live in a city who identify as a "dog person" and the proportion of people that live in a rural area who identify as a "dog person." Round answers to to 4 decimal places. < P1 P2 <arrow_forward
- A pollof 2000 randomly selected students in grades 6 through 8 was conducted and found that 48% enjoy playing sports. Is the 48% result a statistic or a parameter?arrow_forwardA random sample of n1 = 213 people who live in a city were selected and 80 identified as a "dog person." A random sample of n2 = 98 people who live in a rural area were selected and 61 identified as a "dog person." Find the 90% confidence interval for the difference in the proportion of people that live in a city who identify as a "dog person" and the proportion of people that live in a rural area who identify as a "dog person." Round answers to to 4 decimal places. Рі — Р2arrow_forwardA random sample of n₁ = 224 people who live in a city were selected and 90 identified as a "dog person." A random sample of n₂ = 95 people who live in a rural area were selected and 61 identified as a "dog person." Find the 95% confidence interval for the difference in the proportion of people that live in a city who identify as a "dog person" and the proportion of people that live in a rural area who identify as a "dog person." Round answers to to 4 decimal places. P1 P2arrow_forward
- A random sample of n₁ = 269 people who live in a city were selected and 88 identified as a "dog person." A random sample of n2 = 90 people who live in a rural area were selected and 70 identified as a "dog person." Find the 99% confidence interval for the difference in the proportion of people that live in a city who identify as a "dog person" and the proportion of people that live in a rural area who identify as a "dog person." Round answers to to 4 decimal places. < P1 P2 <arrow_forwardA random sample of high school seniors were asked whether they were applying for college. The resulting confidence interval for the proportion of students applying for college is (0.65,0.69). What is the margin of error?arrow_forwardA recent survey of two countries in South America reports on data about foreign-born citizens. Of 500 randomly selected people in Peru, 125 reported as being born in another country; meanwhile, 75 of 800 randonly selected Argentinians reported as being foreign-born. Use this information to create a 95% confidence interval for the true difference in proportions of foreign born citizens between Peru and Argentina.arrow_forward
- A random sample of n - 236 people who live in a city were selected and 81 identified as a "dog person." A random sample of n2 - 109 people who live in a rural area were selected and 60 identified as a "dog person." Find the 90% confidence interval for the difference in the proportion of people that live in a city who identify as a "dog person" and the proportion of people that live in a rural area who identify as a "dog person." Round answers to to 4 decimal places. P1 - P2 Question Help: Message instructor Submit Question Jump to Answerarrow_forwardA random sample of 75 customers was polled. .626 and the 95% confidence intervalarrow_forwardA study was done to determine whether there is a relationship between snoring and the risk of heart disease. Among 1,105 snorers in the study, 85 had heart disease, while only 21 of 1,379 nonsnorers had heart disease. In USE SALT (a) Determine a 95% confidence interval that estimates p, - p2 difference in proportions of snorers and nonsnorers who have heart disease. (Let p, be the proportion of snorers and p, be the proportion of nonsnorers. Round your answers to three decimal places.) |-0.079 X to -0.045arrow_forward
arrow_back_ios
arrow_forward_ios
Recommended textbooks for you
- MATLAB: An Introduction with ApplicationsStatisticsISBN:9781119256830Author:Amos GilatPublisher:John Wiley & Sons Inc
 Probability and Statistics for Engineering and th...StatisticsISBN:9781305251809Author:Jay L. DevorePublisher:Cengage Learning
 Statistics for The Behavioral Sciences (MindTap C...StatisticsISBN:9781305504912Author:Frederick J Gravetter, Larry B. WallnauPublisher:Cengage Learning
  Elementary Statistics: Picturing the World (7th E...StatisticsISBN:9780134683416Author:Ron Larson, Betsy FarberPublisher:PEARSON
 The Basic Practice of StatisticsStatisticsISBN:9781319042578Author:David S. Moore, William I. Notz, Michael A. FlignerPublisher:W. H. Freeman
 Introduction to the Practice of StatisticsStatisticsISBN:9781319013387Author:David S. Moore, George P. McCabe, Bruce A. CraigPublisher:W. H. Freeman
MATLAB: An Introduction with Applications
Statistics
ISBN:9781119256830
Author:Amos Gilat
Publisher:John Wiley & Sons Inc
Probability and Statistics for Engineering and th...
Statistics
ISBN:9781305251809
Author:Jay L. Devore
Publisher:Cengage Learning
Statistics for The Behavioral Sciences (MindTap C...
Statistics
ISBN:9781305504912
Author:Frederick J Gravetter, Larry B. Wallnau
Publisher:Cengage Learning
Elementary Statistics: Picturing the World (7th E...
Statistics
ISBN:9780134683416
Author:Ron Larson, Betsy Farber
Publisher:PEARSON
The Basic Practice of Statistics
Statistics
ISBN:9781319042578
Author:David S. Moore, William I. Notz, Michael A. Fligner
Publisher:W. H. Freeman
Introduction to the Practice of Statistics
Statistics
ISBN:9781319013387
Author:David S. Moore, George P. McCabe, Bruce A. Craig
Publisher:W. H. Freeman