
MATLAB: An Introduction with Applications
6th Edition
ISBN: 9781119256830
Author: Amos Gilat
Publisher: John Wiley & Sons Inc
expand_more
expand_more
format_list_bulleted
Related questions
Question
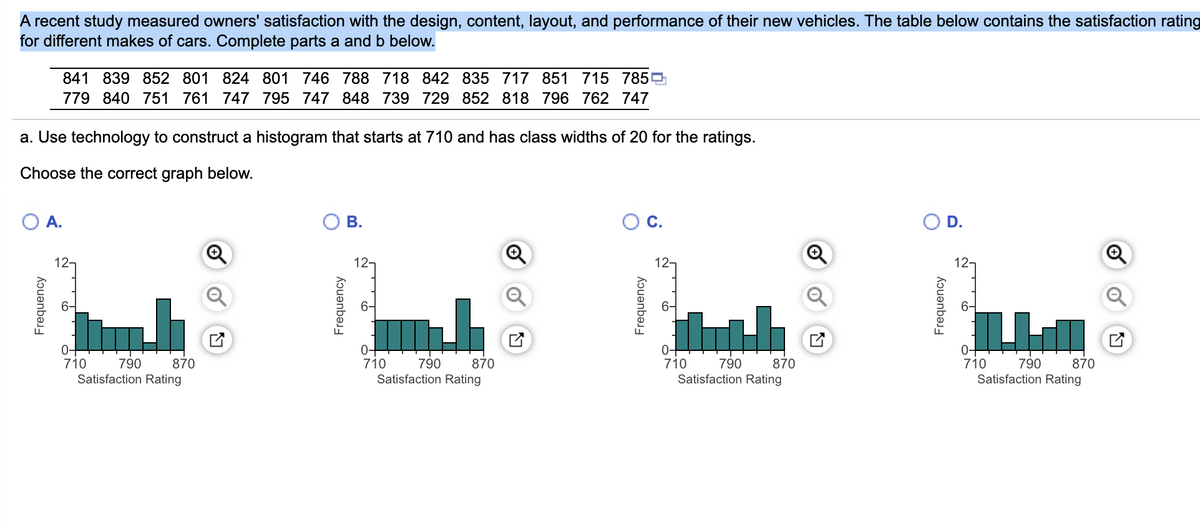

Transcribed Image Text:A recent study measured owners' satisfaction with the design, content, layout, and performance of their new vehicles. The table below contains the satisfaction rating
for different makes of cars. Complete parts a and b below.
841 839 852 801 824 801 746 788 718 842 835 717 851 715 785
779 840 751 761 747 795 747 848 739 729 852 818 796 762 747
a. Use technology to construct a histogram that starts at 710 and has class widths of 20 for the ratings.
Choose the correct graph below.
O A.
Frequency
12-
6-
0-
710
790
Satisfaction Rating
870
B.
Frequency
12-
0+
790
870
Satisfaction Rating
710
C.
Frequency
12-
6-
0+
710 790
870
Satisfaction Rating
O D.
Frequency
12-
0-
710
790
Satisfaction Rating
870
Expert Solution
This question has been solved!
Explore an expertly crafted, step-by-step solution for a thorough understanding of key concepts.

This is a popular solution

Trending nowThis is a popular solution!

Step by stepSolved in 3 steps with 1 images

Knowledge Booster

Similar questions
- In marketing children’s products, it is extremely important to produce television commercials that hold the attention of the children who view them. A psychologist hired by a marketing research firm wants to determine whether differences in attention span exist among advertisements for different types of products. A number of children under 10 years of age are asked to watch one 60-second commercial for one of three types of products, and their attention spans are measured in seconds. The results are shown in the accompanying table: Type of Product Advertised Toys/Games Food/Candy Children’s Clothing 42 55 30 45 58 35 48 52 42 40 60 32 50 57 38 b). What type of error is possible and describe this error in terms of the problem.arrow_forwardA recent report stated that in 1990, there were approximately 9.7 million employment opportunities in a Science, Technology, Engineering or Mathematics (STEM) related field. There is a reported 17.3 million positions available in a STEM related field in 2019. What is the relative change in the number of STEM positions available from 1990 to 2019? A. 7.6% B. 56.1% C. 43.9% D. 78.4%arrow_forwardVirginia polled a large sample of individuals to find the percentage of students with known food allergies and the percentage of students without known food allergies. Which of the following could sufficiently display the data if only the two given categories are to be included? Select the correct answer below: bar graph pie chart either a pie chart or a bar graph neither a pie chart nor a bar grapharrow_forward
- help pleasearrow_forwardThe following table shows some data from a study on substance use among 10th graders in the United States and Europe. Smoked Cigarettes Cigarette-Free Totals U.S. 14,000 Europe 96,000 Total 71,210 110,000arrow_forwardA 2009 Pew Research Center survey asked a sample of 1,504 adults living in the United States for their opinions on recent technological advancements, such as online shopping, cell phones, and social networking. Respondents categorized each advancement as a change for the worse, hasn't made much difference, a change for the better, or don't know. A summary of respondents' opinions on the Internet follows: Response Change for the worse Hasn't made much difference Change for the better. Don't know Percent of Respondents 16 11 65 8 Make a bar graph of the relative frequency distribution of the responses.arrow_forward
arrow_back_ios
arrow_forward_ios
Recommended textbooks for you
- MATLAB: An Introduction with ApplicationsStatisticsISBN:9781119256830Author:Amos GilatPublisher:John Wiley & Sons Inc
 Probability and Statistics for Engineering and th...StatisticsISBN:9781305251809Author:Jay L. DevorePublisher:Cengage Learning
 Statistics for The Behavioral Sciences (MindTap C...StatisticsISBN:9781305504912Author:Frederick J Gravetter, Larry B. WallnauPublisher:Cengage Learning
  Elementary Statistics: Picturing the World (7th E...StatisticsISBN:9780134683416Author:Ron Larson, Betsy FarberPublisher:PEARSON
 The Basic Practice of StatisticsStatisticsISBN:9781319042578Author:David S. Moore, William I. Notz, Michael A. FlignerPublisher:W. H. Freeman
 Introduction to the Practice of StatisticsStatisticsISBN:9781319013387Author:David S. Moore, George P. McCabe, Bruce A. CraigPublisher:W. H. Freeman
MATLAB: An Introduction with Applications
Statistics
ISBN:9781119256830
Author:Amos Gilat
Publisher:John Wiley & Sons Inc
Probability and Statistics for Engineering and th...
Statistics
ISBN:9781305251809
Author:Jay L. Devore
Publisher:Cengage Learning
Statistics for The Behavioral Sciences (MindTap C...
Statistics
ISBN:9781305504912
Author:Frederick J Gravetter, Larry B. Wallnau
Publisher:Cengage Learning
Elementary Statistics: Picturing the World (7th E...
Statistics
ISBN:9780134683416
Author:Ron Larson, Betsy Farber
Publisher:PEARSON
The Basic Practice of Statistics
Statistics
ISBN:9781319042578
Author:David S. Moore, William I. Notz, Michael A. Fligner
Publisher:W. H. Freeman
Introduction to the Practice of Statistics
Statistics
ISBN:9781319013387
Author:David S. Moore, George P. McCabe, Bruce A. Craig
Publisher:W. H. Freeman