
MATLAB: An Introduction with Applications
6th Edition
ISBN: 9781119256830
Author: Amos Gilat
Publisher: John Wiley & Sons Inc
expand_more
expand_more
format_list_bulleted
Related questions
Question
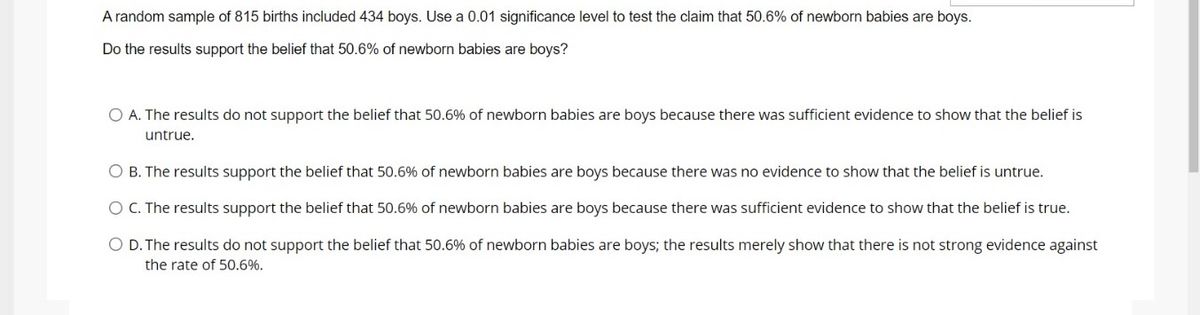

Transcribed Image Text:A random sample of 815 births included 434 boys. Use a 0.01 significance level to test the claim that 50.6% of newborn babies are boys.
Do the results support the belief that 50.6% of newborn babies are boys?
O A. The results do not support the belief that 50.6% of newborn babies are boys because there was sufficient evidence to show that the belief is
untrue.
O B. The results support the belief that 50.6% of newborn babies are boys because there was no evidence to show that the belief is untrue.
O C. The results support the belief that 50.6% of newborn babies are boys because there was sufficient evidence to show that the belief is true.
O D. The results do not support the belief that 50.6% of newborn babies are boys; the results merely show that there is not strong evidence against
the rate of 50.6%.
Expert Solution
This question has been solved!
Explore an expertly crafted, step-by-step solution for a thorough understanding of key concepts.

This is a popular solution

Trending nowThis is a popular solution!

Step by stepSolved in 3 steps with 2 images

Knowledge Booster

Similar questions
- Suppose that in a random selection of 100 colored candies, 23% of them are blue. The candy company claims that the percentage of blue candies is equal to 29%. Use a 0.05 significance level to test that claim. Identify the null and alternative hypotheses for this test. Choose the correct answer below. O A. Ho: p=0.29 H1: p>0.29 O B. Ho: p#0.29 H1:p=0.29 O C. Ho: p=0.29 H1:p#0.29 OD. Ho: p=0.29 H1:p<0.29 Identify the test statistic for this hypothesis test. The test statistic for this hypothesis test is . (Round to two decimal places as needed.) Identify the P-value for this hypothesis test. The P-value for this hypothesis test is (Round to three decimal places as needed.) Identify the conclusion for this hypothesis test. O A. Reject Ho. There is sufficient evidence to warrant rejection of the claim that the percentage of blue candies is equal to 29% O B. Fail to reject Ho. There is sufficient evidence to warrant rejection of the claim that the percentage of blue candies is equal to 29%arrow_forwardA concerned group of citizens wanted to know if the proportion of armed robberies in Texas was different in 2011 than in 2010. Their research showed that of the 113,231 violent crimes in Texas in 2010, 7,622 of them were armed robberies. In 2011, 7,439 of the 104,873 violent crimes were in the armed robbery category. Test at a 5% significance level.a) The null and alternative hypothesis would be: �0:�2010=�2011�1:�2010≠�2011 �0:�2010=�2011�1:�2010<�2011 �0:�2010=�2011�1:�2010≠�2011 �0:�2010=�2011�1:�2010>�2011 �0:�2010=�2011�1:�2010>�2011 �0:�2010=�2011�1:�2010<�2011 b) Determine the test statistic. Round to two decimals.�=c) Find the p-value and round to 4 decimals.p = d) Make a decision. Fail to reject the null hypothesis Reject the null hypothesis e) Write the conclusion. There is not sufficient evidence to support the claim that the proportion of armed robberies is different in 2011 than 2010. There is sufficient evidence to support the claim that the…arrow_forwardIn a study of 779 randomly selected medical malpractice lawsuits, it was found that 470 of them were dropped or dismissed. Use a 0.05 significance level to test the claim that most medical malpractice lawsuits are dropped or dismissed. C Which of the following is the hypothesis test to be conducted? ⒸA. Ho: p=0.5 O B. Ho: p=0.5 H₁: p > 0.5 H₁: p=0.5 O C. Ho: p=0.5 O D. Ho: p=0.5 H₁: p 0.5 H₁: p=0.5 What is the test statistic? 2=0 (Round to two decimal places as needed.) What is the P-value? P-value= (Round to three decimal places as needed.) Nextarrow_forward
- help 14arrow_forwardSuppose that in a random selection of 100 colored candies, 20% of them are blue. The candy company claims that the percentage of blue candies is equal to 26%. Use a 0.01 significance level to test that claim. Identify the null and alternative hypotheses for this test. Choose the correct answer below. O A. Ho: p +0.26 H₁: p=0.26 O B. Ho: p=0.26 H₁: p=0.26 O C. Ho: p = 0.26 H₁: p>0.26 O D. Ho: p=0.26 H₁: p<0.26arrow_forwardSuppose that in a random selection of 100 colored candies, 22% of them are blue. The candy company claims that the percentage of blue candies is equal to 30%. Use a 0.10 significance level to test that claim. Identify the null and alternative hypotheses for this test. Choose the correct answer below. O A. Ho: p=0.3 H₁: p=0.3 O B. Ho: p=0.3 H₁: p=0.3 C. Ho: p=0.3 H₁: p>0.3 O D. Ho: p=0.3 H₁: p<0.3 Identify the test statistic for this hypothesis test. The test statistic for this hypothesis test is (Round to two decimal places as needed.) Identify the P-value for this hypothesis test. The P-value for this hypothesis test is (Round to three decimal places as needed.) Identify the conclusion for this hypothesis test. A. Reject Ho. There is sufficient evidence to warrant rejection of the claim that the percentage of blue candies is equal to 30% B. Reject Ho. There is not sufficient evidence to warrant rejection of the claim that the percentage of blue candies is equal to 30% O C. Fail to…arrow_forward
- Passed Failed White Results from a civil servant exam are shown in the table to the right. Is there sufficient evidence to support the claim that the results from the test are discriminatory? Use a 0.05 significance level. 20 17 candidates Minority candidates 8 22 O A. Ho: Awhite candidate is not more likely to pass the test than a minority candidate. H,: A white candidate is more likely to pass the test than a minority candidate. B. Ho: White and minority candidates do not have the same chance of passing the test. H,: White and minority candidates have the same chance of passing the test. O C. Ho: Awhite candidate is more likely to pass the test than a minority candidate. H,:A white candidate is not more likely to pass the test than a minority candidate. O D. Ho: White and minority candidates have the same chance of passing the test. H4: White and minority candidates do not have the same chance of passing the test. Determine the test statistic. x? = (Round to three decimal places as…arrow_forward✅✅✅✅✅✅✅✅✅✅✅arrow_forwardSuppose that in a random selection of 100 colored candies, 26% of them are blue. The candy company claims that the percentage of blue candies is equal to 25%. Use a 0.05 significance level to test that claim. GEE Identify the null and alternative hypotheses for this est. Choose the correct answer below. O A. Ho: p=0.25 H₁: p>0.25 OB. Ho: p=0.25 H₁: p=0.25 O C. Họ: p=0.25 H₁: p<0.25 le O D. Họ: P±0.25 H₁: p=0.25arrow_forward
arrow_back_ios
arrow_forward_ios
Recommended textbooks for you
- MATLAB: An Introduction with ApplicationsStatisticsISBN:9781119256830Author:Amos GilatPublisher:John Wiley & Sons Inc
 Probability and Statistics for Engineering and th...StatisticsISBN:9781305251809Author:Jay L. DevorePublisher:Cengage Learning
 Statistics for The Behavioral Sciences (MindTap C...StatisticsISBN:9781305504912Author:Frederick J Gravetter, Larry B. WallnauPublisher:Cengage Learning
  Elementary Statistics: Picturing the World (7th E...StatisticsISBN:9780134683416Author:Ron Larson, Betsy FarberPublisher:PEARSON
 The Basic Practice of StatisticsStatisticsISBN:9781319042578Author:David S. Moore, William I. Notz, Michael A. FlignerPublisher:W. H. Freeman
 Introduction to the Practice of StatisticsStatisticsISBN:9781319013387Author:David S. Moore, George P. McCabe, Bruce A. CraigPublisher:W. H. Freeman
MATLAB: An Introduction with Applications
Statistics
ISBN:9781119256830
Author:Amos Gilat
Publisher:John Wiley & Sons Inc
Probability and Statistics for Engineering and th...
Statistics
ISBN:9781305251809
Author:Jay L. Devore
Publisher:Cengage Learning
Statistics for The Behavioral Sciences (MindTap C...
Statistics
ISBN:9781305504912
Author:Frederick J Gravetter, Larry B. Wallnau
Publisher:Cengage Learning
Elementary Statistics: Picturing the World (7th E...
Statistics
ISBN:9780134683416
Author:Ron Larson, Betsy Farber
Publisher:PEARSON
The Basic Practice of Statistics
Statistics
ISBN:9781319042578
Author:David S. Moore, William I. Notz, Michael A. Fligner
Publisher:W. H. Freeman
Introduction to the Practice of Statistics
Statistics
ISBN:9781319013387
Author:David S. Moore, George P. McCabe, Bruce A. Craig
Publisher:W. H. Freeman