ENGR.ECONOMIC ANALYSIS
14th Edition
ISBN: 9780190931919
Author: NEWNAN
Publisher: Oxford University Press
expand_more
expand_more
format_list_bulleted
Question

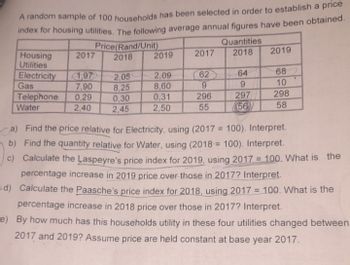
Transcribed Image Text:A random sample of 100 households has been selected in order to establish a price
index for housing utilities. The following average annual figures have been obtained.
Housing
Utilities
2017
Electricity 1,97
Gas
7,90
0,29
2,40
Telephone
Water
Price(Rand/Unit)
2018
2,05
8,25
0,30
2,45
2019
2,09
8,60
0,31
2,50
2017
62
9
296
55
Quantities
2018
64
9
297
56
2019
68
10
298
58
.
a) Find the price relative for Electricity, using (2017= 100). Interpret.
b) Find the quantity relative for Water, using (2018= 100). Interpret.
c) Calculate the Laspeyre's price index for 2019, using 2017 = 100. What is the
percentage increase in 2019 price over those in 2017? Interpret.
d) Calculate the Paasche's price index for 2018, using 2017 = 100. What is the
percentage increase in 2018 price over those in 2017? Interpret.
e) By how much has this households utility in these four utilities changed between
2017 and 2019? Assume price are held constant at base year 2017.
Expert Solution
This question has been solved!
Explore an expertly crafted, step-by-step solution for a thorough understanding of key concepts.
Step by stepSolved in 6 steps

Knowledge Booster
Learn more about
Need a deep-dive on the concept behind this application? Look no further. Learn more about this topic, economics and related others by exploring similar questions and additional content below.Similar questions
- 1 MCQ 1 of 25 Aroha has to choose among three possible activities to do on Sunday morning. She ranks her preferences (from most preferred option to least preferred option) as follows: attend the local community Church service with her Nan; hang out with friends at the Westfield Manukau City Shopping Centre; go and watch the Counties Manukau rugby league game. What is her opportunity cost of attending Church with her Nan (Option 1)? Select one alternative: Hanging out with her friends and watching the rugby league game. There is no opportunity cost. Hanging out with her friends. Either hanging out with her friends or watching the rugby league game.arrow_forwardA buyer for an electrical component is searching for a supplier who has the best combination of low price, low order cycle time and low order cycle variability.Current uage for the component is 100 units per day. the buyer received data on four potineital suppliers (table) Based on the order cycle time, variability and unit price data provided in the table, which supplier should be awarded the component business?arrow_forwardCA fiscal year runs from Group of answer choices Oct 1, 2014- Sept 30, 2015 Apr 1, 2014 – Mar 31, 2015 Jan 1, 2014 - Dec 31, 2014 July 1, 2014 – June 30, 2015arrow_forward
- 3arrow_forwardCompute to three decimal places. (See attached) Initial values are: PX = $9500 PY = $10000 I = $15000 A = $170000 W = 160 This function is: Qs = 89830 -40PS +20PX +15PY +2I +.001A +10Warrow_forwardThe initial population of a town is 5 000, and it grows with a doubling time of 8 years. What will the population be in 12 years?arrow_forward
- Consider the interval of random numbers presented below. The following random numbers have been generated: 99, 98, 26, 32, 49, 52, 33, 02, 09, 17. Simulate 10 hours of arrivals at this gas station based on the random numbers. What is the average number of arrivals during this period? # of Cars Use the editor to format your answer 6 7 8 9 Interval of Random Numbers 01-20 21-48 49-84 85-00 ***arrow_forwardPLS HELP ASAP ON BOTHarrow_forwardA group of participants was surveyed and the information collected shown in the partially completed contingency table below regarding the site of skin cancer. Firstly, calculate the missing values. Melanoma Other Total Head U 43 X Trunk 52 V 98 Extremities 142 112 Y Total 229 W Z Now, using the completed contingency table, select the statements from the following list that are true. Note: a statement is true only if the value you calculated from the completed contingency table, when rounded to the same number of decimal places as in the statement, is the same as the value in the statement. 18.1% of skin cancers appear on the head 71.4% of skin cancers were melanomas or appeared on the head Given the skin cancer is something other than melanoma, the probability it is not on the extremities is 0.443 Of skin cancers appearing on the trunk, 46.9% are not melanomasarrow_forward
arrow_back_ios
SEE MORE QUESTIONS
arrow_forward_ios
Recommended textbooks for you

 Principles of Economics (12th Edition)EconomicsISBN:9780134078779Author:Karl E. Case, Ray C. Fair, Sharon E. OsterPublisher:PEARSON
 Engineering Economy (17th Edition)EconomicsISBN:9780134870069Author:William G. Sullivan, Elin M. Wicks, C. Patrick KoellingPublisher:PEARSON
 Principles of Economics (MindTap Course List)EconomicsISBN:9781305585126Author:N. Gregory MankiwPublisher:Cengage Learning
 Managerial Economics: A Problem Solving ApproachEconomicsISBN:9781337106665Author:Luke M. Froeb, Brian T. McCann, Michael R. Ward, Mike ShorPublisher:Cengage Learning
 Managerial Economics & Business Strategy (Mcgraw-...EconomicsISBN:9781259290619Author:Michael Baye, Jeff PrincePublisher:McGraw-Hill Education


Principles of Economics (12th Edition)
Economics
ISBN:9780134078779
Author:Karl E. Case, Ray C. Fair, Sharon E. Oster
Publisher:PEARSON

Engineering Economy (17th Edition)
Economics
ISBN:9780134870069
Author:William G. Sullivan, Elin M. Wicks, C. Patrick Koelling
Publisher:PEARSON

Principles of Economics (MindTap Course List)
Economics
ISBN:9781305585126
Author:N. Gregory Mankiw
Publisher:Cengage Learning

Managerial Economics: A Problem Solving Approach
Economics
ISBN:9781337106665
Author:Luke M. Froeb, Brian T. McCann, Michael R. Ward, Mike Shor
Publisher:Cengage Learning

Managerial Economics & Business Strategy (Mcgraw-...
Economics
ISBN:9781259290619
Author:Michael Baye, Jeff Prince
Publisher:McGraw-Hill Education