
College Algebra
1st Edition
ISBN: 9781938168383
Author: Jay Abramson
Publisher: OpenStax
expand_more
expand_more
format_list_bulleted
Related questions
Question
(See image for introduction)
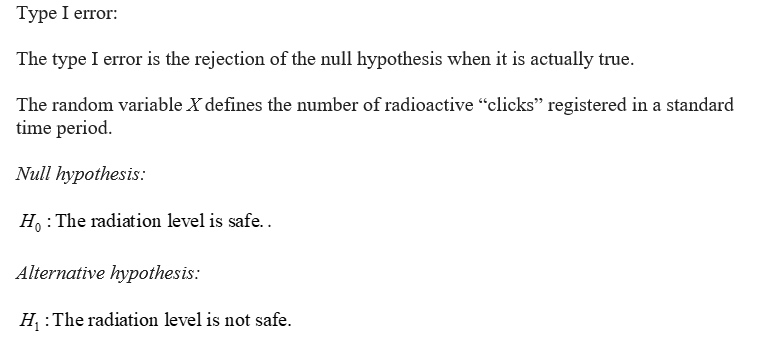
What is the type I error probability for this approach? (PLUG-IN completely, NO need to simplify.)
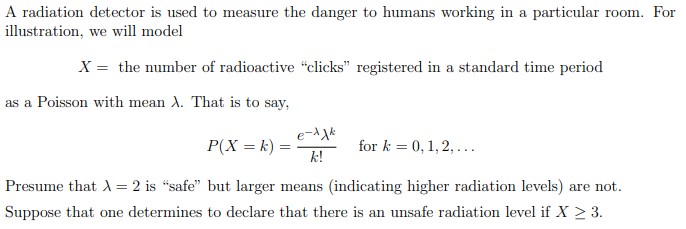

Transcribed Image Text:A radiation detector is used to measure the danger to humans working in a particular room. For
illustration, we will model
X = the number of radioactive "clicks" registered in a standard time period
as a Poisson with mean A. That is to say,
P(X = k) =
e-dAk
for k = 0, 1, 2, ...
k!
Presume that A = 2 is "safe" but larger means (indicating higher radiation levels) are not.
Suppose that one determines to declare that there is an unsafe radiation level if X > 3.
Expert Solution
arrow_forward
Step 1

Step by stepSolved in 2 steps with 2 images

Knowledge Booster


Learn more about
Need a deep-dive on the concept behind this application? Look no further. Learn more about this topic, statistics and related others by exploring similar questions and additional content below.Similar questions
- What does the y -intercept on the graph of a logistic equation correspond to for a population modeled by that equation?arrow_forwardApproximate the population mean and standard deviation of age for females. By the way, we find the midpoints by adding the first numbers before the hyphens in the age column and then dividing by 2 (ex: 0+10/2=5, 10+20/2=15, 20+30/2=25).arrow_forwardClimate change 2013 Data collected from around the globe show that the earth is getting warmer. The most common theory relates climate change to an increase in atmospheric levels of carbon dioxide (CO2), a greenhouse gas. The mean annual CO2 concentration in the atmosphere (parts per million) is measured at the top of Mauna Loa in Hawaii (away from any local contaminants) and available at ftp://aftp.cmdl.noaa.gov/products/trends/co2/co2_annmean_mlo.txt The mean surface air temperature is recorded as the change in °C relative to a base period of 1951 to 1980. It is available at data.giss.nasa.gov/gistemp/graphs_v3/ Here are a scatterplot and regression for the years from 1970 to 2013: 14.6 + 14.4 + 14.2 + 14.0 340 360 380 CO2 Response variable is R-squared = 73.6% R-squared (adjusted) = 72.9% s = 0.1316 with 44 – 2 = 42 degrees of freedom Global Avg Temp Variable Coefficient SE(Coeff) t-Ratio P-Value Intercept 10.6442 0.3418 31.1 S0.0001 0.010325 0.0010 10.8 S0.0001 a) Write the…arrow_forward
- Unfortunately, arsenic occurs naturally in some ground water.t A mean arsenic level of u = 8.0 parts per billion (ppb) is considered safe for agricultural use. A well in Texas is used to water cotton crops. This well is tested on a regular basis for arsenic. A random sample of 36 tests gave a sample mean of x = 7.1 ppb arsenic, with s = 2.2 ppb. Does this information indicate that the mean level of arsenic in this well is less than 8 ppb? Use a = 0.01. A USE SALT (a) What is the level of significance? State the null and alternate hypotheses. O Ho: H= 8 ppb; H,: H > 8 ppb O Ho: H 8 ppb; H: H = 8 ppb (b) What sampling distribution will you use? Explain the rationale for your choice of sampling distribution. O The standard normal, since the sample size is large and a is unknown. O The Student's t, since the sample size is large and a is known. O The standard normal, since the sample size is large and a is known. O The Student's t, since the sample size is large and a is unknown. What is…arrow_forwardUnfortunately, arsenic occurs naturally in some ground water.t A mean arsenic level of u = 8.0 parts per billion (ppb) is considered safe for agricultural use. A well in Texas is used to water cotton crops. This well is tested on a regular basis for arsenic. A random sample of 36 tests gave a sample mean of x = 7.1 ppb arsenic, with s = 2.2 ppb. Does this information indicate that the mean level of arsenic in this well is less than 8 ppb? Use a = 0.01. A USE SALT (a) What is the level of significance? State the null and alternate hypotheses. O Họ: u = 8 ppb; H,: u > 8 ppb O Ho: H 8 ppb; H,: u = 8 ppb (b) What sampling distribution will you use? Explain the rationale for your choice of sampling distribution. The standard normal, since the sample size is large and a is unknown. O The Student's t, since the sample size is large and a is known. O The standard normal, since the sample size is large and a is known. The Student's t, since the sample size is large and a is unknown. What is the…arrow_forwardUnfortunately, arsenic occurs naturally in some ground water.t A mean arsenic level of u = 8.0 parts per billion (ppb) is considered safe for agricultural use. A well in Texas is used to water cotton crops. This well is tested on a regular basis for arsenic. A random sample of 36 tests gave a sample mean of x = 6.7 ppb arsenic, with s = 3.0 ppb. Does this information indicate that the mean level of arsenic in this well is less than 8 ppb? Use a = 0.01. n USE SALT (a) What is the level of significance? State the null and alternate hypotheses. O Ho: H = 8 ppb; H,: u > 8 ppb O Ho: H = 8 ppb; H,: H + 8 ppb O Ho: H 8 ppb; H,: u = 8 ppb O Ho: H = 8 ppb; H,: µ 0.100 O 0.050 < P-value < 0.100 O 0.010 < P-value < 0.050 O 0.005 < P-value < 0.010 P-value < 0.005 Sketch the sampling distribution and show the area corresponding to the P-value. MacBook Pro escarrow_forward
- A population of N=15 has a mean =8 one score in the population is changed from X=20 to X-5.What is the value for thr new population mean?arrow_forwardChapt 4, Q8: Answer this question please The antibody production of 12 male red-winged blackbirds before and after receiving testosterone implants was compared. The units for antibody levels were natural log (10-3 optical density) per minute (ln(mOD/min)). The mean change in antibody production was d = 0.056, and the standard deviation was sd = 0.240 If you were assigned the task of repeating this experiment, and wanted to ensure that you could detect a mean change of 0.08 units with a probability of 0.8, then what sample size would you use? Since we are calculating n for a study of individuals, answers should be rounded to the closest whole number.arrow_forwardBelow is data of lobster sales volume from a seafood company. We're are using exponential smoothing (α = 0.5) and 3-year moving average to forecast it. a) Fill the blanks above and write your processes below. b) What are the mean absolute deviations (MADs) of the two methods? Whichmethod will you choose based on the results? *Please solve for a-b, either type your work and answers or write them neatly on paper* thank you!arrow_forward
- The failure time (T) of an electronic circuit board follows exponentially distribution with failure rate λ = 10−4/h. What is the probability that (i) it will fail before 1000 h? (ii) it will survive at least 10,000 h ? (iii) it will fail between 1000 and 10,000 h? (iv)Determine the mean time to failure. .arrow_forwardqu(16): The flavour of juicy fruit is said to last on average 2 minutes. A consumer product reseacher wanted to find out if this is true. and hypothezise than juicy fruit would last longer due to changing sticks to pellet pieces. The reseacher tested 10 pieces and the following data was recorded 1.45 , 1.50, 1.45, 1.75, 2.15, 2.20 , 1.80 , 1.95, 2.05, 1.60 Test the hypotheses at the 5% level of using the following 5 step procedure. Step1: Set up Null hypothesis Step 2: Set up Alternative hypothesis. Step 3: Choose the level of signifance. Step 4: Compute Zobt( using the z score) Step 5: compare Zobt and Zcrt and make a decision.arrow_forward
arrow_back_ios
arrow_forward_ios
Recommended textbooks for you
 Glencoe Algebra 1, Student Edition, 9780079039897...AlgebraISBN:9780079039897Author:CarterPublisher:McGraw Hill
 Big Ideas Math A Bridge To Success Algebra 1: Stu...AlgebraISBN:9781680331141Author:HOUGHTON MIFFLIN HARCOURTPublisher:Houghton Mifflin Harcourt
 Linear Algebra: A Modern IntroductionAlgebraISBN:9781285463247Author:David PoolePublisher:Cengage Learning
Glencoe Algebra 1, Student Edition, 9780079039897...
Algebra
ISBN:9780079039897
Author:Carter
Publisher:McGraw Hill
Big Ideas Math A Bridge To Success Algebra 1: Stu...
Algebra
ISBN:9781680331141
Author:HOUGHTON MIFFLIN HARCOURT
Publisher:Houghton Mifflin Harcourt
Linear Algebra: A Modern Introduction
Algebra
ISBN:9781285463247
Author:David Poole
Publisher:Cengage Learning