
MATLAB: An Introduction with Applications
6th Edition
ISBN: 9781119256830
Author: Amos Gilat
Publisher: John Wiley & Sons Inc
expand_more
expand_more
format_list_bulleted
Related questions
Question
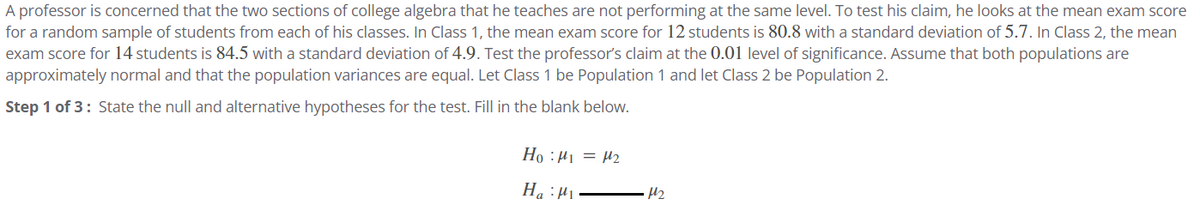

Transcribed Image Text:A professor is concerned that the two sections of college algebra that he teaches are not performing at the same level. To test his claim, he looks at the mean exam score
for a random sample of students from each of his classes. In Class 1, the mean exam score for 12 students is 80.8 with a standard deviation of 5.7. In Class 2, the mean
exam score for 14 students is 84.5 with a standard deviation of 4.9. Test the professor's claim at the 0.01 level of significance. Assume that both populations are
approximately normal and that the population variances are equal. Let Class 1 be Population 1 and let Class 2 be Population 2.
Step 1 of 3: State the null and alternative hypotheses for the test. Fill in the blank below.
Ho: M₁ = 4₂
Ha: M
M₂
SAVE
AI-Generated Solution
info
AI-generated content may present inaccurate or offensive content that does not represent bartleby’s views.
Unlock instant AI solutions
Tap the button
to generate a solution
to generate a solution
Click the button to generate
a solution
a solution
Knowledge Booster

Similar questions
- According to the College Board, scores on the math section of the SAT Reasoning college entrance test for the class of 2010 had a mean of 516 and a standard deviation of 116. Assume that they are roughly normal.One of the quartiles of the scores from the math section of the SAT Reasoning test is 438. The other quartile is _______.arrow_forwardA professor believes that, for the introductory art history classes at his university, the mean test score of students in the evening classes is lower than the mean test score of students in the morning classes. He collects data from a random sample of 250 students in evening classes and finds that they have a mean test score of 76.8. He knows the population standard deviation for the evening classes to be 7.2 points. A random sample of 200 students from morning classes results in a mean test score of 77.8. He knows the population standard deviation for the morning classes to be 1.9 points. Test his claim with a 90% level of confidence. Let students in the evening classes be Population 1 and let students in the morning classes be Population 2. Step 1 of 3 : State the null and alternative hypotheses for the test. Fill in the blank below. H0: μ1=μ2 Ha: μ1__μ2arrow_forwardIn preparation for the upcoming school year, a teacher looks at raw test scores on the statewide standardized test for the students in her class. Instead of looking at the scores relative to the norms in the state, the teacher wants to understand the scores relative to the students who will be in the class. To do so, she decides to convert the test scores into z-scores relative to the mean and standard deviation of the students in the class. The mean test score in her upcoming class is 49, and the standard deviation is 20.7. The teacher now wants to identify those students who may need extra help. She decides to look at students who have z-scores below z = -2.00 Identify the test score corresponding to a z-score of below z = -2.00. Round to the nearest whole number.arrow_forward
- The manager of a major retail store has taken a random sample of 25 customers. The average sale was $52.50. The population standard deviation is known to be $6.10. The manager would like to determine whether or not the mean sales by all customers are significantly more than $50. What is the p-value for the test?arrow_forwardLucy recently switched her primary doctor to one specializing in caring for elderly patients. On her new doctor's website, it says that the mean systolic blood pressure among elderly females is 120 millimeters of mercury (mmHg). Lucy believes the value is actually higher. She bases her belief on a recently reported study of 19 randomly selected, elderly females. The sample mean systolic blood pressure was 132 mmHg, and the sample standard deviation was 24 mmHg. Assume that the systolic blood pressures of elderly females are approximately normally distributed. Based on the study, at the 0.05 level of significance, can it be concluded that μ, the population mean systolic blood pressure among elderly females, is greater than 120 mmHg? Perform a one-tailed test. Then complete the parts below. Carry your intermediate computations to three or more decimal places. (If necessary, consult a list of formulas.) esc (a) State the null hypothesis H and the alternative hypothesis H₁. Ho: H₁:0 (b)…arrow_forwardAnn recently switched her primary doctor to one specializing in caring for elderly patients. On her new doctor's website, it says that the mean systolic blood pressure among elderly females is 120 millimeters of mercury ( mmHg ). Ann believes the value is actually higher. She bases her belief on a recently reported study of 10 randomly selected, elderly females. The sample mean systolic blood pressure was 128 mmHg , and the sample standard deviation was 25 mmHg . Assume that the systolic blood pressures of elderly females are approximately normally distributed. Based on the study, at the 0.10 level of significance, can it be concluded that μ , the population mean systolic blood pressure among elderly females, is greater than 120 mmHg ? Perform a one-tailed test. Then complete the parts below. Carry your intermediate computations to three or more decimal places. (If necessary, consult a list of formulas.) (a) State the null hypothesis H0 and the…arrow_forward
- An instructor claims that the average number of hours needed to study for a final exam in order to pass should be 5 hours. A student believes that the instructor is understating the number of hours needed to pass and surveys 36 students and finds the sample mean and standard deviation to be 5.7 and 1.5 hours respectively. Test the instructors claim at a .10 level.arrow_forwardUse z scores to compare the given values. The tallest living man at one time had a height of 238 cm. The shortest living man at that time had a height of 142.4 cm. Heights of men at that time had a mean of 175.45 cm and a standard deviation of 5.59 cm. Which of these two men had the height that was more extreme? ... Since the z score for the tallest man is z = 0 and the z score for the shortest man is z = the man had the height that was Im- more extreme. (Round to two decimal places.) shortest tallestarrow_forwardHeather recently switched her primary doctor to one specializing in caring for elderly patients. On her new doctor's website, it says that the mean systolic blood pressure among elderly females is 115 millimeters of mercury (mmHg). Heather believes the value is actually higher. She bases her belief on a recently reported study of 13 randomly selected, elderly females. The sample mean systolic blood pressure was 125 mmHg, and the sample standard deviation was 25 mmHg. C Assume that the systolic blood pressures of elderly females are approximately normally distributed. Based on the study, at the 0.05 level of significance, can it be concluded that u, the population mean systolic blood pressure among elderly females, is greater than 115 mmHg? Perform a one-tailed test. Then complete the parts below. Carry your intermediate computations to three or more decimal places. (If necessary, consult a list of formulas.) (a) state the null hypothesis Ho and the alternative hypothesis H₁. 1 H₂ : 0…arrow_forward
- Amanda recently switched her primary doctor to one specializing in caring for elderly patients. On her new doctor's website, it says that the mean systolic blood pressure among elderly females is 115 millimeters of mercury (mmHg). Amanda believes the value is actually higher. She bases her belief on a recently reported study of 17 randomly selected, elderly females. The sample mean systolic blood pressure was 123 mmHg, and the sample standard deviation was 23 mmHg. Assume that the systolic blood pressures of elderly females are approximately normally distributed. Based on the study, at the 0.05 level of significance, can it be concluded that μ, the population mean systolic blood pressure among elderly females, is greater than 115 mmHg? Perform a one-tailed test. Then complete the parts below. Carry your intermediate computations to three or more decimal places. A. Find the value of the test statistic and round to 3 or more decimal places. (I have posted a picture of an example problem…arrow_forwardJeff is doing an experiment involving mice. The mice weights have mean weight 2.37 ounces and standard deviation 0.053 ounces. Jeff selects 9 mice independently and calculates the sample mean, x̄, of their weights. What is the standard deviation of x̄?arrow_forwardA newspaper article reports that the mean cost for preventative dental care per year is $175 with a standard deviation of $35 (assume that this is the population standard deviation). You want to test whether the mean cost for preventative dental care in your company is different from what was reported in the article. You take a random sample of 250 employees and find the mean cost is $171. Does this signficantly differ from what was reported in the article? Run the appropriate test at α=0.05. Give each of the following to receive full credit: 1) the appropriate null and alternative hypotheses; 2) the appropriate test; 3) the decision rule; 4) the calculation of the test statistic; and 5) your conclusion including a comparison to alpha or the critical value. You MUST show your work to receive full credit. Partial credit is available.arrow_forward
arrow_back_ios
SEE MORE QUESTIONS
arrow_forward_ios
Recommended textbooks for you
- MATLAB: An Introduction with ApplicationsStatisticsISBN:9781119256830Author:Amos GilatPublisher:John Wiley & Sons Inc
 Probability and Statistics for Engineering and th...StatisticsISBN:9781305251809Author:Jay L. DevorePublisher:Cengage Learning
 Statistics for The Behavioral Sciences (MindTap C...StatisticsISBN:9781305504912Author:Frederick J Gravetter, Larry B. WallnauPublisher:Cengage Learning
  Elementary Statistics: Picturing the World (7th E...StatisticsISBN:9780134683416Author:Ron Larson, Betsy FarberPublisher:PEARSON
 The Basic Practice of StatisticsStatisticsISBN:9781319042578Author:David S. Moore, William I. Notz, Michael A. FlignerPublisher:W. H. Freeman
 Introduction to the Practice of StatisticsStatisticsISBN:9781319013387Author:David S. Moore, George P. McCabe, Bruce A. CraigPublisher:W. H. Freeman
MATLAB: An Introduction with Applications
Statistics
ISBN:9781119256830
Author:Amos Gilat
Publisher:John Wiley & Sons Inc
Probability and Statistics for Engineering and th...
Statistics
ISBN:9781305251809
Author:Jay L. Devore
Publisher:Cengage Learning
Statistics for The Behavioral Sciences (MindTap C...
Statistics
ISBN:9781305504912
Author:Frederick J Gravetter, Larry B. Wallnau
Publisher:Cengage Learning
Elementary Statistics: Picturing the World (7th E...
Statistics
ISBN:9780134683416
Author:Ron Larson, Betsy Farber
Publisher:PEARSON
The Basic Practice of Statistics
Statistics
ISBN:9781319042578
Author:David S. Moore, William I. Notz, Michael A. Fligner
Publisher:W. H. Freeman
Introduction to the Practice of Statistics
Statistics
ISBN:9781319013387
Author:David S. Moore, George P. McCabe, Bruce A. Craig
Publisher:W. H. Freeman