
MATLAB: An Introduction with Applications
6th Edition
ISBN: 9781119256830
Author: Amos Gilat
Publisher: John Wiley & Sons Inc
expand_more
expand_more
format_list_bulleted
Related questions
Question
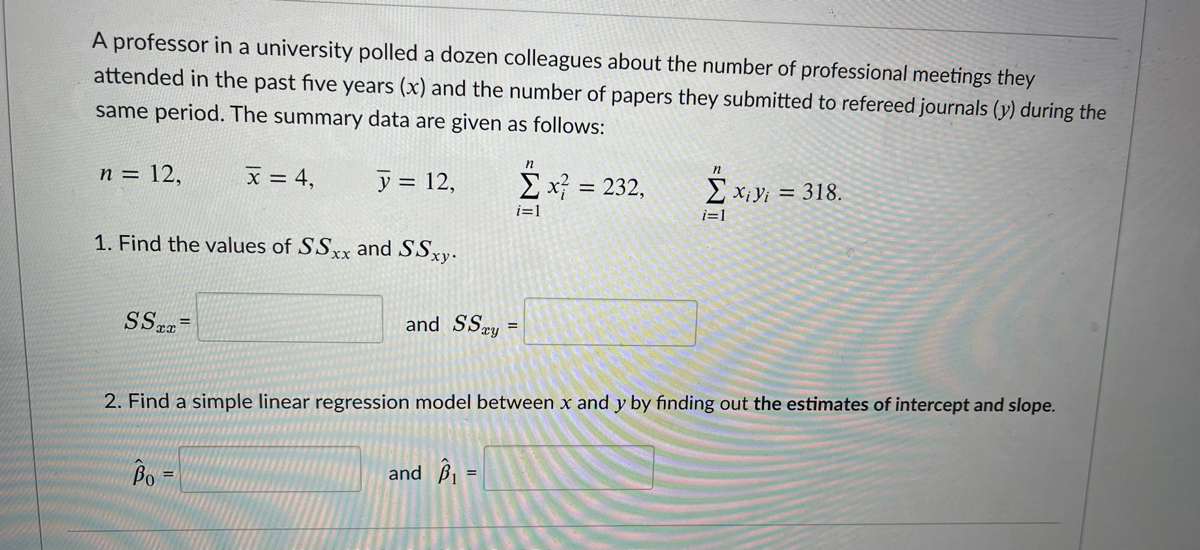

Transcribed Image Text:A professor in a university polled a dozen colleagues about the number of professional meetings they
attended in the past five years (x) and the number of papers they submitted to refereed journals (y) during the
same period. The summary data are given as follows:
n = 12,
x = 4,
y = 12,
Σx?232,
2 x;yi = 318.
i=1
i=1
1. Find the values of SSXX and SSxy.
and SSy
2. Find a simple linear regression model between x and y by finding out the estimates of intercept and slope.
Bo =
and B =
%3D
Expert Solution
This question has been solved!
Explore an expertly crafted, step-by-step solution for a thorough understanding of key concepts.

This is a popular solution

Trending nowThis is a popular solution!

Step by stepSolved in 4 steps with 4 images

Knowledge Booster


Learn more about
Need a deep-dive on the concept behind this application? Look no further. Learn more about this topic, statistics and related others by exploring similar questions and additional content below.Similar questions
- The line of best fit through a set of data is ý = 38.241 – 1.827r According to this equation, what is the predicted value of the dependent variable when the independent variable has value 20? y = Round to 1 decimal place.arrow_forwardA researcher is interested in testing the relationship between smoking and BMI (kg/m2) in adults aged 30-45. In order to test this association, the researcher divides smoking into currently more than a pack a day, currently less than a pack a day, and never smokers. The following table represents the BMIs for each participant enrolled by their respective smoking category. Current Smoker (≥1pack/day) Current Smoker (<1 pack/day Never Smoked 26.7 29.4 22.1 29.4 28.6 30.4 24.3 27.4 21.3 28.4 23.2 26.4 21.6 20.1 19.7 27.4 20.6 19.8 26.8 19.7 21.6 36.4 19.6 22.3 31.5 21.6 24.3 27.4 21.5 *Continue as though all assumptions for ANOVA are met. A) Calculate the MSW and MSB for the data represented above. B) Carry out a formal test for a one-way analysis of variance among the groups and interpret your results.arrow_forwardSuppose u1 and uz are true mean stopping distances at 50 mph for cars of a certain type equipped with two different types of braking systems. The data follows: m = 6, x = 115.6, s1 = 5.03, n = 6, y = 129.9, and s2 = 5.38. Calculate a 95% CI for the difference between true average stopping distances for cars equipped with system 1 and cars equipped with system 2. (Round your answers to two decimal places.) In USE SALT Does the interval suggest that precise information about the value of this difference is available? Because the interval is so narrow, it appears that precise information is available. Because the interval is so narrow, it appears that precise information is not available. o Because the interval is so wide, it appears that precise information is not available. o Because the interval is so wide, it appears that precise information is available.arrow_forward
- Fill the chi square for Cross 1 and Cross 2 from the following data in the attached image: Cross 1: Phenotypes Ratio Observed Expected (O-E)2/E Totals X2 = Cross 2: Phenotypes Ratio Observed Expected (O-E)2/E Totals X2 =arrow_forwardplease answer correctly:arrow_forwardGiven the “data” determined by y = x^3 + (x-1)^2 with x = 0.1, 1.2, 2.3, and 2.9, calculate SSTO, SSR, and R^2. Then recalculate these using x = 0.3, 1, 2.45, and 2.8. Does where you collect your data (i.e., which values of x) appear to impact your interpretation of how good the linear model fits?.arrow_forward
- The authors of a paper compared two different methods for measuring body fat percentage. One method uses ultrasound, and the other method uses X-ray technology. The table gives body fat percentages for 16 athletes using each of these methods (a subset of the data given in a graph that appeared in the paper). For purposes of this exercise, you can assume that the 16 athletes who participated in this study are representative of the population of athletes. Athlete 0 Ho: Md = Ha: Md 0 < 0 5 6 7 8 9 10 11 12 13 14 15 16 X-ray 4.75 7.00 9.25 12.00 17.25 29.50 5.50 6.00 8.00 8.50 9.25 11.00 12.00 14.00 17.00 18.00 USE SALT Ultrasound 4.75 4.00 9.00 11.75 17.00 27.75 6.50 6.75 8.75 9.75 9.50 12.00 12.25 15.75 18.00 18.50 X Find the test statistic and P-value. (Use a table or SALT. Round your test statistic to one decimal place and your P-value to three decimal places.) t = P-value = 0.000 Mx-ray ultrasound.)arrow_forwardA study was conducted at a local college to analyze the average cumulative GPA of students who graduated last year. Which of these terms is used to refer to: the average cumulative GPA of students in the study who graduated from the college last year?arrow_forwardA researcher wants to test the association between 4 stress levels and 8 choices of favorite color in mature adults. The Chi-square value coputed was 30.72. At the 0.5 level what should the researcher conclue. Show work.arrow_forward
arrow_back_ios
arrow_forward_ios
Recommended textbooks for you
- MATLAB: An Introduction with ApplicationsStatisticsISBN:9781119256830Author:Amos GilatPublisher:John Wiley & Sons Inc
 Probability and Statistics for Engineering and th...StatisticsISBN:9781305251809Author:Jay L. DevorePublisher:Cengage Learning
 Statistics for The Behavioral Sciences (MindTap C...StatisticsISBN:9781305504912Author:Frederick J Gravetter, Larry B. WallnauPublisher:Cengage Learning
  Elementary Statistics: Picturing the World (7th E...StatisticsISBN:9780134683416Author:Ron Larson, Betsy FarberPublisher:PEARSON
 The Basic Practice of StatisticsStatisticsISBN:9781319042578Author:David S. Moore, William I. Notz, Michael A. FlignerPublisher:W. H. Freeman
 Introduction to the Practice of StatisticsStatisticsISBN:9781319013387Author:David S. Moore, George P. McCabe, Bruce A. CraigPublisher:W. H. Freeman
MATLAB: An Introduction with Applications
Statistics
ISBN:9781119256830
Author:Amos Gilat
Publisher:John Wiley & Sons Inc
Probability and Statistics for Engineering and th...
Statistics
ISBN:9781305251809
Author:Jay L. Devore
Publisher:Cengage Learning
Statistics for The Behavioral Sciences (MindTap C...
Statistics
ISBN:9781305504912
Author:Frederick J Gravetter, Larry B. Wallnau
Publisher:Cengage Learning
Elementary Statistics: Picturing the World (7th E...
Statistics
ISBN:9780134683416
Author:Ron Larson, Betsy Farber
Publisher:PEARSON
The Basic Practice of Statistics
Statistics
ISBN:9781319042578
Author:David S. Moore, William I. Notz, Michael A. Fligner
Publisher:W. H. Freeman
Introduction to the Practice of Statistics
Statistics
ISBN:9781319013387
Author:David S. Moore, George P. McCabe, Bruce A. Craig
Publisher:W. H. Freeman