
MATLAB: An Introduction with Applications
6th Edition
ISBN: 9781119256830
Author: Amos Gilat
Publisher: John Wiley & Sons Inc
expand_more
expand_more
format_list_bulleted
Related questions
Concept explainers
Topic Video
Question
A professor at a large community college wanted to determine whether there is a difference in the means of final exam scores between students who took his statistics course online and the students who took his face-to-face statistics class. He believed that the
Please answer letters d-f. Thank you
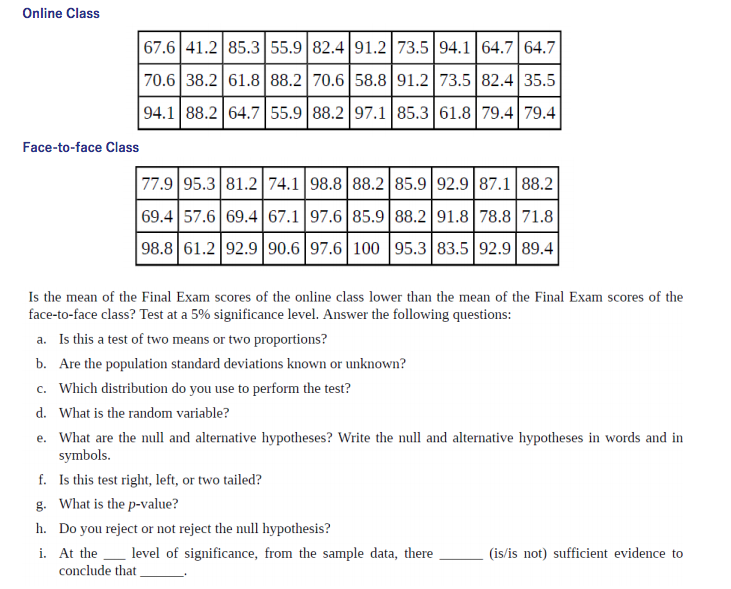

Transcribed Image Text:Online Class
67.6 41.2 85.3 55.9 82.4 91.2 73.5 94.1 64.7 64.7
70.6 38.2 61.8 88.2 70.6 58.8 91.2 73.5 82.4 35.5
94.1 88.2 64.7 55.9|88.2 97.1|85.3 61.8 79.4 79.4
Face-to-face Class
77.9 95.3 81.2 74.1 98.8 88.2 85.9 92.9 87.1 88.2
69.4 57.6 69.4 67.1 97.6|85.9 88.2 91.8 78.8 71.8
98.8 61.2 92.9 90.6 97.6| 100 95.3 83.5 92.9| 89.4
Is the mean of the Final Exam scores of the online class lower than the mean of the Final Exam scores of the
face-to-face class? Test at a 5% significance level. Answer the following questions:
a. Is this a test of two means or two proportions?
b. Are the population standard deviations known or unknown?
c. Which distribution do you use to perform the test?
d. What is the random variable?
e. What are the null and alternative hypotheses? Write the null and alternative hypotheses in words
symbols.
in
f. Is this test right, left, or two tailed?
g. What is the p-value?
h. Do you reject or not reject the null hypothesis?
i. At the level of significance, from the sample data, there
(is/is not) sufficient evidence to
conclude that
Expert Solution
This question has been solved!
Explore an expertly crafted, step-by-step solution for a thorough understanding of key concepts.

This is a popular solution

Trending nowThis is a popular solution!

Step by stepSolved in 2 steps

Knowledge Booster


Learn more about
Need a deep-dive on the concept behind this application? Look no further. Learn more about this topic, statistics and related others by exploring similar questions and additional content below.Similar questions
- Suppose you are an operations manager for a plant that manufactures batteries. Give an example of how you could use descriptive statistics to make better managerial decisions. Give an example of how you could use inferential statistics to make better managerial decisions.Say whether this or that example describes the use of descriptive or inferential statistics.arrow_forwardSuppose that the mean score of a class of 34 students was 78. The 19 male students in the class had a mean score of 66. What was the mean score for the 15 female students? Mean Score for Female Studentsarrow_forwardFind the median?arrow_forward
- Suppose that the mean score of a class of 34 students was 79. The 15 male students in the class had a mean score of 62. What was the mean score for the 19 female students? Mean Score for Female Students = preview answersarrow_forwardNikko compares the prices of a skateboard at 7 different online stores. His data is shown below. $67.50, $70.00, $102.25, $65.25, $58.75, $62.00, $68.20 13 Given this information, which statement is true? A The mean and median have the same value. B. The mean is the better measure of center than the median. CThe median is a better measure of center than the mean. D. The median is affected more by the outlier than the mean. DELLarrow_forwardfind an example of when statistics were misused/skewed and state the reason why you think the statistics were reported that way.arrow_forward
- A mathematics professor lost a test paper belonging to one of her students. She remembered that the mean score for the class of 20 was 81 and that the sum of the 19 other scores was 1530. What was the grade on the paper she lost?arrow_forwardDiscuss how statistics, as a way of organizing and summarizing data, helped make good decisions when shoppingarrow_forwardGive an example of a set of data that might be better represented by the median than the mean. Explain why.arrow_forward
- The Centers for Disease Control (CDC) want to study the effects of lead exposure on children. They randomly select 2500 children from Olympia, Washington. What is the sample and the population?arrow_forwardSuppose that the mean score of a class of 34 students was 78. The 17 male students in the class had a mean score of 62. What was the mean score for the 17 female students?arrow_forwardThe ages of employees at two local restaurants are listed in order. Restaurant A - 21, 21, 23, 25, 26, 27, 30, 34 Restaurant B - 23, 25, 25, 25, 26, 27, 27, 30 Determine the difference between the mode in these two data sets. Use the keypad to input your answer. The difference in mode between the two data sets isarrow_forward
arrow_back_ios
SEE MORE QUESTIONS
arrow_forward_ios
Recommended textbooks for you
- MATLAB: An Introduction with ApplicationsStatisticsISBN:9781119256830Author:Amos GilatPublisher:John Wiley & Sons Inc
 Probability and Statistics for Engineering and th...StatisticsISBN:9781305251809Author:Jay L. DevorePublisher:Cengage Learning
 Statistics for The Behavioral Sciences (MindTap C...StatisticsISBN:9781305504912Author:Frederick J Gravetter, Larry B. WallnauPublisher:Cengage Learning
  Elementary Statistics: Picturing the World (7th E...StatisticsISBN:9780134683416Author:Ron Larson, Betsy FarberPublisher:PEARSON
 The Basic Practice of StatisticsStatisticsISBN:9781319042578Author:David S. Moore, William I. Notz, Michael A. FlignerPublisher:W. H. Freeman
 Introduction to the Practice of StatisticsStatisticsISBN:9781319013387Author:David S. Moore, George P. McCabe, Bruce A. CraigPublisher:W. H. Freeman
MATLAB: An Introduction with Applications
Statistics
ISBN:9781119256830
Author:Amos Gilat
Publisher:John Wiley & Sons Inc
Probability and Statistics for Engineering and th...
Statistics
ISBN:9781305251809
Author:Jay L. Devore
Publisher:Cengage Learning
Statistics for The Behavioral Sciences (MindTap C...
Statistics
ISBN:9781305504912
Author:Frederick J Gravetter, Larry B. Wallnau
Publisher:Cengage Learning
Elementary Statistics: Picturing the World (7th E...
Statistics
ISBN:9780134683416
Author:Ron Larson, Betsy Farber
Publisher:PEARSON
The Basic Practice of Statistics
Statistics
ISBN:9781319042578
Author:David S. Moore, William I. Notz, Michael A. Fligner
Publisher:W. H. Freeman
Introduction to the Practice of Statistics
Statistics
ISBN:9781319013387
Author:David S. Moore, George P. McCabe, Bruce A. Craig
Publisher:W. H. Freeman