A First Course in Probability (10th Edition)
10th Edition
ISBN: 9780134753119
Author: Sheldon Ross
Publisher: PEARSON
expand_more
expand_more
format_list_bulleted
Question

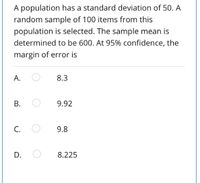
Transcribed Image Text:A population has a standard deviation of 50. A
random sample of 100 items from this
population is selected. The sample mean is
determined to be 600. At 95% confidence, the
margin of error is
A.
8.3
9.92
C.
9.8
D.
8.225
B.

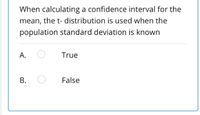
Transcribed Image Text:When calculating a confidence interval for the
mean, the t- distribution is used when the
population standard deviation is known
А.
True
В.
False
Expert Solution
This question has been solved!
Explore an expertly crafted, step-by-step solution for a thorough understanding of key concepts.
This is a popular solution
Trending nowThis is a popular solution!
Step by stepSolved in 2 steps

Knowledge Booster
Similar questions
- Heights (cm) and weights (kg) are measured for 100 randomly selected adult males, and range from heights of 135 to190 cm and weights of 39to150kg. Let the predictor variable x be the first variable given. The 100 paired measurements yield x̄ =167.89 cm, ȳ = 81.55kg, r=0.414, P- value=0.000, and ŷ =−103+1.04x. Find the best predicted value of ŷ (weight) given an adult male who is184 cm tall. Use a 0.05 significance level. The best predicted value of ŷ for an adult male who is 184 cm tall is ___kg.arrow_forwardHeights (cm) and weights (kg) are measured for 100 randomly selected adult males, and range from heights of 132 to 190 cm and weights of 41 to 150 kg. Let the predictor variable x be the first variable given. The 100 paired measurements yield x=167.40 cm, y=81.39 kg, r=0.172, P-value=0.087, and y=−103+1.02x. Find the best predicted value of y (weight) given an adult male who is 143 cm tall. Use a 0.10 significance level. The best predicted value of y for an adult male who is 143 cm tall is enter your response here kg. (Round to two decimal places as needed.)arrow_forwardHeights (cm) and weights (kg) are measured for 100 randomly selected adult males, and range from heights of 138 to 187 cm and weights of 40 to 150 kg. Let the predictor variable x be the first variable given. The 100 paired measurements yield x=167.94 cm, y=81.54 kg, r=0.261, P value=0.009, and y=−102+1.03x. Find the best predicted value of y (weight) given an adult male who is 181 cm tall. Use a 0.10 significance level.arrow_forward
- Heights (cm) and weights (kg) are measured for 100 randomly selected adult males, and range from heights of 133 to 188 cm and weights of 40 to 150 kg. Let the predictor variable x be the first variable given. The 100 paired measurements yield x=167.80 cm, y=81.36 kg, r=0.286, P-value=0.004, and y=−108+1.19x. Find the best predicted value of y (weight) given an adult male who is 138 cm tall. Use a 0.10 significance level.arrow_forwardA sample of ?=14n=14 observations is drawn from a normal population with ?=1030μ=1030 and ?=200σ=200. Find each of the following: A. ?(?¯>1110)P(X¯>1110) Probability = B. ?(?¯<944)P(X¯<944) Probability = C. ?(?¯>997)P(X¯>997) Probability =arrow_forwardsuppose that 43% of people who enter a store will make a purchase. Random samples of people who walk into a particular store is studied, and the proportion of those who made a purchase is found for each sample. Assume that all the samples were the same size. If 29.46% of all sample proportions are less than 0.3274. What was the z-score for 0.3274? What is σp′?arrow_forward
- Stoaches are fictional creatures, sometimes mistaken for mome raths. Suppose a two-tailed t-test is conducted to test for a difference between the population means of adult female stoach weights and adult male stoach weights. The female sample has 13 weights, and the male sample has 7 weights. The t-statistic for the test is -0.20542. What is the p-value? (Give your answer to 4 decimal places.) p-value:arrow_forwardHow would I find the answer with my TI-84?I have no idea what to do after getting P(Z< -1.55).....? Mean is 11.1Standard Deviation: 4.5n = 40I got so far: 10-11.1 = -1.1 / 4.5 divided by the square root of 40so around : -1.55arrow_forwardHeights (cm) and weights (kg) are measured for 100 randomly selected adult males, and range from heights of 133133 to 190190 cm and weights of 3737 to 150150 kg. Let the predictor variable x be the first variable given. The 100 paired measurements yield x overbarxequals=168.08168.08 cm, y overbaryequals=81.5781.57 kg, requals=0.3130.313, P-valueequals=0.0020.002, and ModifyingAbove y with caretyequals=negative 108−108plus+1.121.12x. Find the best predicted value of ModifyingAbove y with carety (weight) given an adult male who is 169169 cm tall. Use a 0.050.05 significance level. The best predicted value of ModifyingAbove y with carety for an adult male who is 169169 cm tall is (answer) kg. (Round to two decimal places as needed.)arrow_forward
- Choose the letter of the correct answerarrow_forwardHeights (cm) and weights (kg) are measured for 100 randomly selected adult males, and range from heights of 131131 to 194194 cm and weights of 4141 to 150150 kg. Let the predictor variable x be the first variable given. The 100 paired measurements yield x overbarxequals=167.50167.50 cm, y overbaryequals=81.4381.43 kg, requals=0.4180.418, P-valueequals=0.0000.000, and ModifyingAbove y with caretyequals=negative 105−105plus+1.191.19x. Find the best predicted value of ModifyingAbove y with carety (weight) given an adult male who is 150150 cm tall. Use a 0.100.10 significance level. The best predicted value of ModifyingAbove y with carety for an adult male who is 150150 cm tall is nothing kg. (Round to two decimal places as needed.)arrow_forward
arrow_back_ios
arrow_forward_ios
Recommended textbooks for you
 A First Course in Probability (10th Edition)ProbabilityISBN:9780134753119Author:Sheldon RossPublisher:PEARSON

A First Course in Probability (10th Edition)
Probability
ISBN:9780134753119
Author:Sheldon Ross
Publisher:PEARSON
