MATLAB: An Introduction with Applications
6th Edition
ISBN: 9781119256830
Author: Amos Gilat
Publisher: John Wiley & Sons Inc
expand_more
expand_more
format_list_bulleted
Question

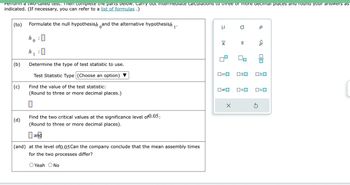
Transcribed Image Text:Perform a two-lailed test. Then complete the parts delow. Carry out intermediate calculations to three or more decimal places and round your answers as
indicated. (If necessary, you can refer to a list of formulas .)
(to)
(b)
(c)
(d)
Formulate the null hypothesish and the alternative hypothesish
0
h :
0
h
1
0
Determine the type of test statistic to use.
Test Statistic Type (Choose an option)
Find the value of the test statistic:
(Round to three or more decimal places.)
Find the two critical values at the significance level of 0.05;
(Round to three or more decimal places).
and
(and) at the level of 0.05 Can the company conclude that the mean assembly times
for the two processes differ?
O Yeah O No
μ
X
0=0
о р
X
S
OSO
0#0 0<0
<Q
5
010
ロミロ

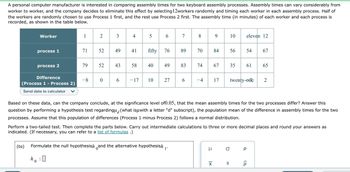
Transcribed Image Text:personal computer manufacturer is interested in comparing assembly times for two keyboard assembly processes. Assembly times can vary considerably from
worker to worker, and the company decides to eliminate this effect by selecting12workers randomly and timing each worker in each assembly process. Half of
the workers are randomly chosen to use Process 1 first, and the rest use Process 2 first. The assembly time (in minutes) of each worker and each process is
recorded, as shown in the table below.
Worker
process 1
process 2
Difference
(Process 1 - Process 2)
Send data to calculator
0
1
71
79
2
52
52
-8 0
3
49
43
6
4
41
58
- 17
5
6
fifty 76
40
49
10 27
7
(to) Formulate the null hypothesish and the alternative hypothesish 1.
:0
89
83
6
8
70 84
9
74 67
-4 17
μ
XI
10 eleven 12
Based on these data, can the company conclude, at the significance level of0.05, that the mean assembly times for the two processes differ? Answer this
question by performing a hypothesis test regardingμ (what isµwith a letter "d" subscript), the population mean of the difference in assembly times for the two
processes. Assume that this population of differences (Process 1 minus Process 2) follows a normal distribution.
a
56
Perform a two-tailed test. Then complete the parts below. Carry out intermediate calculations to three or more decimal places and round your answers as
indicated. (If necessary, you can refer to a list of formulas .)
S
54
35 61 65
67
twenty-one 2
р
<Q
Expert Solution
This question has been solved!
Explore an expertly crafted, step-by-step solution for a thorough understanding of key concepts.
Step by stepSolved in 7 steps with 19 images

Knowledge Booster
Similar questions
- StarHortons Cup, the coffee company, wants to determine how long caffeine lasts throughout the day when individuals have a cup of one of their 3 types of coffee at 9am. They will then measure the levels of caffeine in these individuals’ systems at 10am, 12am, 2pm, 4pm, 6pm and 8pm. They want to have at least 20 observations per group. How many separate/distinct groups of participants are needed if they want to conduct this experiment using a mixed-measures ANOVA? 18 6 20 3arrow_forwardThe owner of a chain of mini-markets wants to compare the sales performance of two of her stores, Store 1 and Store 2. Sales can vary considerably depending on the day of the week and the season of the year, so she decides to eliminate such effects by making sure to record each store's sales on the same 8 days, chosen at random. She records the sales (in dollars) for each store on these days, as shown in the table below. Day 1 2 3 4 5 6 7 8 Store 1 889 699 534 398 432 213 252 929 Store 2 479 525 252 364 160 32 234 632 Difference(Store 1 - Store 2) 410 174 282 34 272 181 18 297 Send data to calculator Based on these data, can the owner conclude, at the 0.10 level of significance, that the mean daily sales of the two stores differ? Answer this question by performing a hypothesis test regarding μd (which is μ…arrow_forwardIn IBM SPSS, what does clicking on this icon do?arrow_forward
- A researcher thinks some social media sites are more prone to narcissistic behavior (excessive posting) than others. To examine the relationship between narcissism and social media, she recruits users of three different social media sites (Facebook, Twitter and Instagram), follows them for 24 hours and records the number of posts made by each user. The number of posts is given in the table below. Twitter Facebook Instagram 10 7 14 10 8. 10 10 10 11 9. www. 12 wwww. 11 13 12 8. 7 8. 11 8 10 12 11 11 a. Perform a complete hypothesis test to determine whether there are any significant differences among the three groups. Test at the .05 level of significance. SHOW ALL YOUR WORK b. Do you need to perform post hocs? Explain but do not compute the post hocs. C. Compute effect size. d. Summarize your findings in a source table. e. Write an interpretation of our results in APA-format (include means and SDs in your interpretation)arrow_forwardEvery day a school bus driver passes the same traffic light twice, once before school and once after. Each time he passes the light, he records if it is red, green, or yellow. Here is a summary of the data he got after 200 days. Traffic light before school red red red green green green yellow yellow yellow Traffic light after school red green yellow red green yellow red green yellow Number of days 25 38 12 34 36 11 16 13 15 Suppose the driver will continue recording the colors for 150 more days. In how many of these 150 days will the light be yellow exactly once? Use the data to make a prediction.arrow_forwardThe table shows the leading causes of death in a certain country in a recent year. The population of the country was 311311 million. If you lived in a typical city of 500,000, how many people would you expect to die of cancercancer each year? Cause Deaths Cause Deaths Heart disease 596 comma 700596,700 Alzheimer's disease 84 comma 90084,900 Cancer 575 comma 300575,300 Diabetes 73 comma 40073,400 Chronic respiratory diseases 143 comma 100143,100 Pneumonia/Influenza 53 comma 40053,400 Stroke 128 comma 600128,600 Kidney disease 45 comma 30045,300 Accidents 122 comma 500122,500 Suicide 38 comma 60038,600 About people would be expected to die of cancer each year. (Type a whole number. Round to the nearest person as needed.)arrow_forward
arrow_back_ios
arrow_forward_ios
Recommended textbooks for you
 MATLAB: An Introduction with ApplicationsStatisticsISBN:9781119256830Author:Amos GilatPublisher:John Wiley & Sons Inc
 Probability and Statistics for Engineering and th...StatisticsISBN:9781305251809Author:Jay L. DevorePublisher:Cengage Learning
 Statistics for The Behavioral Sciences (MindTap C...StatisticsISBN:9781305504912Author:Frederick J Gravetter, Larry B. WallnauPublisher:Cengage Learning
 Elementary Statistics: Picturing the World (7th E...StatisticsISBN:9780134683416Author:Ron Larson, Betsy FarberPublisher:PEARSON
 The Basic Practice of StatisticsStatisticsISBN:9781319042578Author:David S. Moore, William I. Notz, Michael A. FlignerPublisher:W. H. Freeman
 Introduction to the Practice of StatisticsStatisticsISBN:9781319013387Author:David S. Moore, George P. McCabe, Bruce A. CraigPublisher:W. H. Freeman

MATLAB: An Introduction with Applications
Statistics
ISBN:9781119256830
Author:Amos Gilat
Publisher:John Wiley & Sons Inc

Probability and Statistics for Engineering and th...
Statistics
ISBN:9781305251809
Author:Jay L. Devore
Publisher:Cengage Learning

Statistics for The Behavioral Sciences (MindTap C...
Statistics
ISBN:9781305504912
Author:Frederick J Gravetter, Larry B. Wallnau
Publisher:Cengage Learning

Elementary Statistics: Picturing the World (7th E...
Statistics
ISBN:9780134683416
Author:Ron Larson, Betsy Farber
Publisher:PEARSON

The Basic Practice of Statistics
Statistics
ISBN:9781319042578
Author:David S. Moore, William I. Notz, Michael A. Fligner
Publisher:W. H. Freeman

Introduction to the Practice of Statistics
Statistics
ISBN:9781319013387
Author:David S. Moore, George P. McCabe, Bruce A. Craig
Publisher:W. H. Freeman