MATLAB: An Introduction with Applications
6th Edition
ISBN: 9781119256830
Author: Amos Gilat
Publisher: John Wiley & Sons Inc
expand_more
expand_more
format_list_bulleted
Concept explainers
Topic Video
Question

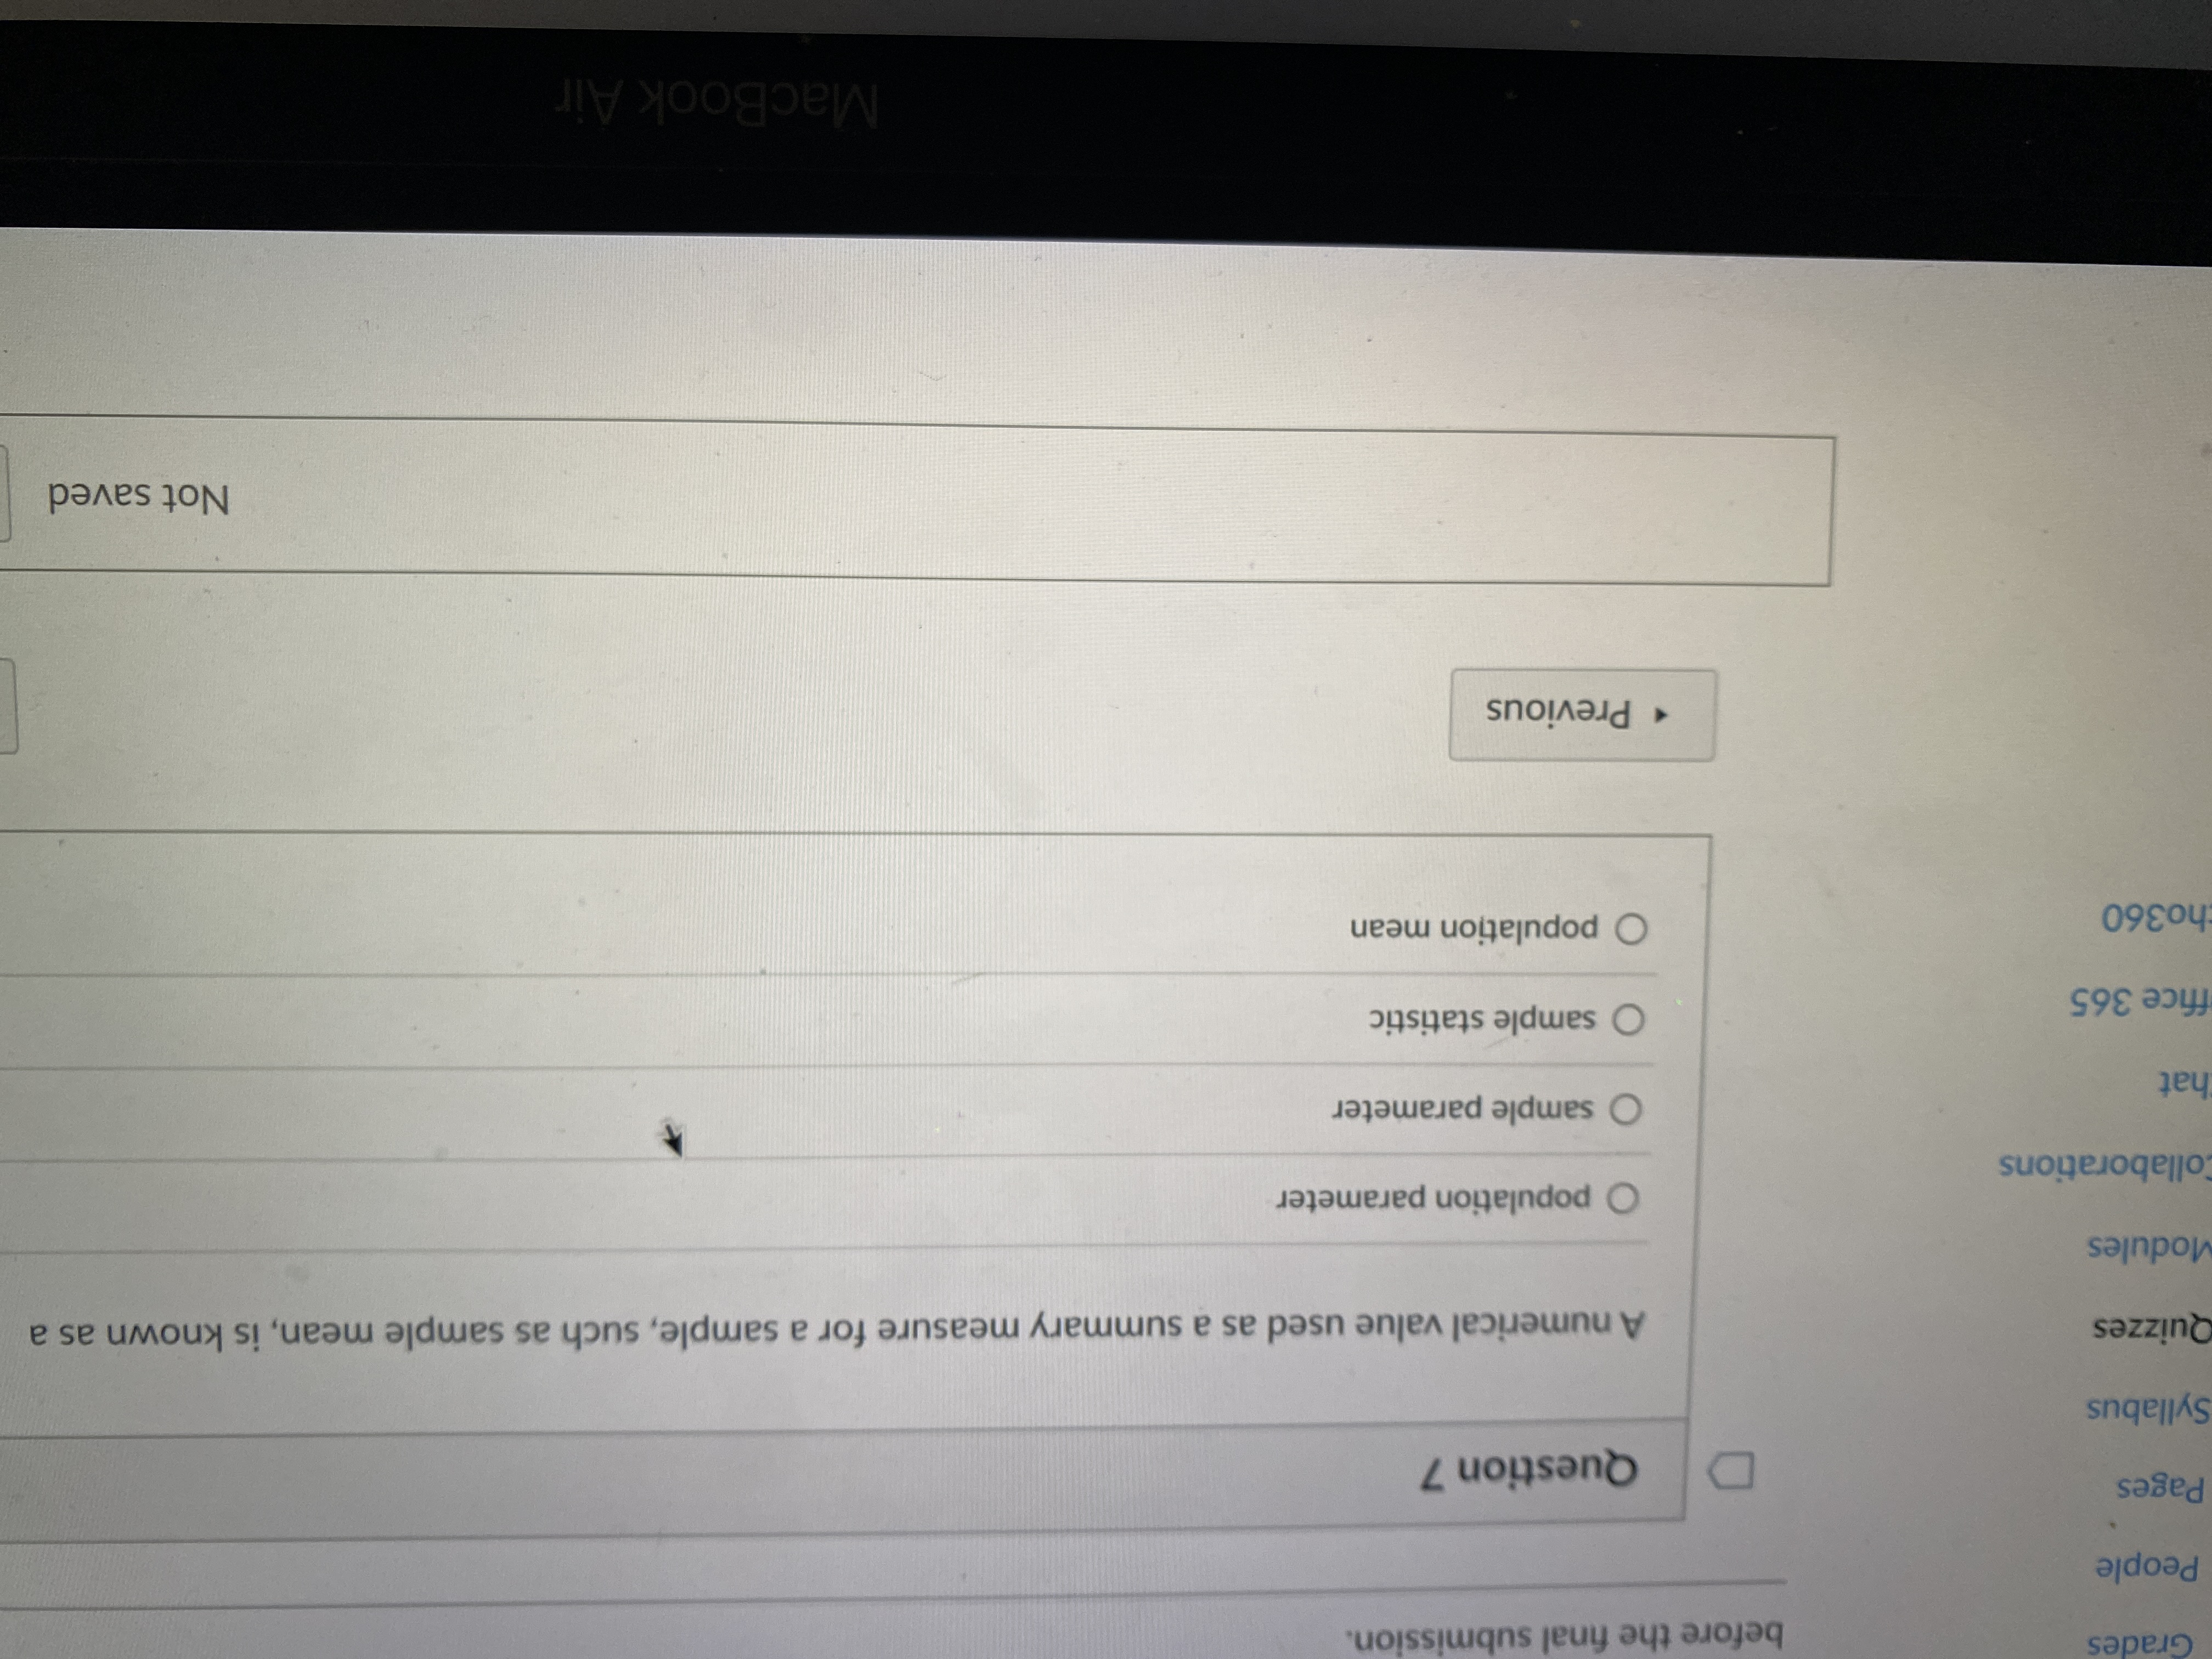
Transcribed Image Text:A numerical value used as a summary measure for a sample, such as sample mean, is known as a
O population parameter
O sample parameter
O sample statistic
O populatjon mean
Expert Solution
This question has been solved!
Explore an expertly crafted, step-by-step solution for a thorough understanding of key concepts.
Step by stepSolved in 2 steps

Knowledge Booster
Learn more about
Need a deep-dive on the concept behind this application? Look no further. Learn more about this topic, statistics and related others by exploring similar questions and additional content below.Similar questions
- find mean median and mode 45,42,52,50,54,50,58,56,57,54,50,52,53,54,51,50,58,59,50,arrow_forwardfind mean median and mode 42,45,47,48,42,40,45,46,48,47,49,42,41,40,45,45,45,48,46,42,48,45,45,43,45,41,47arrow_forwardConsider the data that was obtained from a random sample of 41 credit card accounts. Identify all the averages (mean, median, or mode) that can be used to summarize the name of credit card (e.g., MasterCard, Visa, American Express, etc.) O median if it exists mean and mode if it exists O mean, median, and mode if it exists O mode if it exists mean if it existsarrow_forward
- How do I explain if the mean and median are different, comparing the tibia length before and after hurricane. BEFORE: Mean: 12.15197 Median: 12.96 AFTER: Mean:11.92828 Median: 12.16arrow_forwardWhat is the mean of these numbers rounded to the nearest 10th ? What is the Median ? 8,4,8,7,7,9,6,5,10,7,6,6arrow_forwardFind the (a) mean, (b) median, (c) mode, (d) midrange for the data and then (e) answer the given question! Listed below are the jersey numbers of 11 players randomly selected from the roster of a championship sports team. What do the result tell us? 43,80, 84, 36, 82, 57, 73, 54, 93, 29, 72arrow_forward
- What is the median value of 1.8, 7.4, 27.5, 54.8, 8.5 ?arrow_forwardSuppose that the following fiqures show the price of silver per ounce, in dollars, for a 10-business-day period 12.5,12.2,12.3,12.2,12,11.7,11.7,12.1,11.8 Find the sample mean, median, and mode mean= median= mode= What do your answers tell you about the price of silver? Over the 10-business-day period samples, the price of averaged $ _____ per ounce. It was above $______ as many as it was below that price, and stood at $_____ per ounce more often than at any other price.arrow_forwardA retail survey asked college students how much they planned to spend in various categories during the upcoming academic year. One category is the amount students planned to spend on school supplies. The data below show the amount of money students planned to spend on school supplies. 58, 60, 67, 69, 70, 73, 74, 77, 78, 80, 83, 84, 87, 89, 94, 96, 97, 100, 102, 105 USE SALT (a) Calculate the mean and median for the distribution of money students planned to spend on school supplies. mean median (b) What is the 75th percentile of the distribution? (c) Determine the five-number summary. minimum Q₁ median Q3 maximumarrow_forward
- What is the one-sample t-test for the mean? WRite it in words and formulas.arrow_forwardUsing the artofstat.com website, click on Web Apps, Permutation Test.You should be on the tab at the top of the screen that says "Data Entry and Descriptive Stats." Make sure that it is selected. We are going to enter the data to run a permutation test to see if there is a difference in the mean amount of time spent on emails per day between in state and out of state students. First select "Enter Your Own Observations". Under Name of Group 1 enter: In state Students Under Name of Group 2 enter: Out of state students. Under Name of Response Variable enter: time. Enter the below data under the heading "Enter observations for each group, separated by spaces, or copy & paste from spreadsheet:" Group 1: In state students: 2 3 3 6 2 1 1 5 3 2.5 Group 2: Out of state students: 1 2 2 1 2 1 4 3 9 1 15 4 1 Click the tab at the top of the screen that says "Permutation Distribution." Make sure that the option "Select Test Statistic:" says "Difference of sample means".…arrow_forwardAre written conclusions a form of statistics?arrow_forward
arrow_back_ios
SEE MORE QUESTIONS
arrow_forward_ios
Recommended textbooks for you
 MATLAB: An Introduction with ApplicationsStatisticsISBN:9781119256830Author:Amos GilatPublisher:John Wiley & Sons Inc
 Probability and Statistics for Engineering and th...StatisticsISBN:9781305251809Author:Jay L. DevorePublisher:Cengage Learning
 Statistics for The Behavioral Sciences (MindTap C...StatisticsISBN:9781305504912Author:Frederick J Gravetter, Larry B. WallnauPublisher:Cengage Learning
 Elementary Statistics: Picturing the World (7th E...StatisticsISBN:9780134683416Author:Ron Larson, Betsy FarberPublisher:PEARSON
 The Basic Practice of StatisticsStatisticsISBN:9781319042578Author:David S. Moore, William I. Notz, Michael A. FlignerPublisher:W. H. Freeman
 Introduction to the Practice of StatisticsStatisticsISBN:9781319013387Author:David S. Moore, George P. McCabe, Bruce A. CraigPublisher:W. H. Freeman

MATLAB: An Introduction with Applications
Statistics
ISBN:9781119256830
Author:Amos Gilat
Publisher:John Wiley & Sons Inc

Probability and Statistics for Engineering and th...
Statistics
ISBN:9781305251809
Author:Jay L. Devore
Publisher:Cengage Learning

Statistics for The Behavioral Sciences (MindTap C...
Statistics
ISBN:9781305504912
Author:Frederick J Gravetter, Larry B. Wallnau
Publisher:Cengage Learning

Elementary Statistics: Picturing the World (7th E...
Statistics
ISBN:9780134683416
Author:Ron Larson, Betsy Farber
Publisher:PEARSON

The Basic Practice of Statistics
Statistics
ISBN:9781319042578
Author:David S. Moore, William I. Notz, Michael A. Fligner
Publisher:W. H. Freeman

Introduction to the Practice of Statistics
Statistics
ISBN:9781319013387
Author:David S. Moore, George P. McCabe, Bruce A. Craig
Publisher:W. H. Freeman