
MATLAB: An Introduction with Applications
6th Edition
ISBN: 9781119256830
Author: Amos Gilat
Publisher: John Wiley & Sons Inc
expand_more
expand_more
format_list_bulleted
Related questions
Question
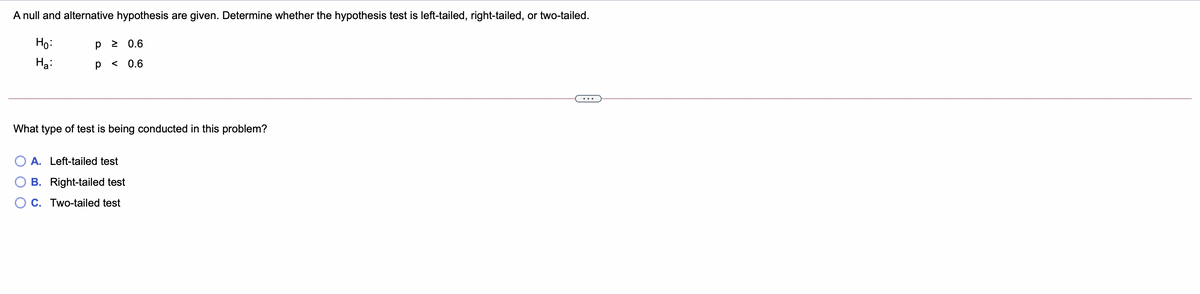

Transcribed Image Text:A null and alternative hypothesis are given. Determine whether the hypothesis test is left-tailed, right-tailed, or two-tailed.
Ho:
2 0.6
На
0.6
What type of test is being conducted in this problem?
O A. Left-tailed test
B. Right-tailed test
C. Two-tailed test
Expert Solution
This question has been solved!
Explore an expertly crafted, step-by-step solution for a thorough understanding of key concepts.

Step by stepSolved in 2 steps

Knowledge Booster

Similar questions
- Test the claim that the proportion of people who own cats is larger than 50% at the 0.01 significance level.The null and alternative hypothesis would be: H0:p=0.5 H1:p>0.5 The test is right tailed Based on a sample of 100 people, 51% owned catsThe p-value is: (to 2 decimals)arrow_forwardTest the claim that the proportion of people who own cats is smaller than 10% at the 0.025 significance level.The null and alternative hypothesis would be: Based on a sample of 800 people, 1% owned catsThe test statistic is: (Round to 2 decimals)The p-value is: (Round to 2 decimals)arrow_forwardFill in the blank. The The is a value used in making a decision about the null hypothesis and is found by converting the sample statistic to a score with the assumption that the null hypothesis is true. is a value used in making a decision about the null hypothesis and is found by converting the sample statistic to a score with the assumption that the null hypothesis is true.arrow_forward
- Test the claim that the mean GPA of night students is smaller than 2.5 at the 0.10 significance level. The null and alternative hypothesis would be: Но:р — 0.625 Но:р 0.625 Но:> 2.5 Но: д %3 2.5 Но: н 0.625 Н:р 2.5 The test is: right-tailed two-tailed left-tailed Based on a sample of 55 people, the sample mean GPA was 2.47 with a standard deviation of 0.03 The p-value is: (to 2 decimals) Based on this we: O Reject the null hypothesis O Fail to reject the null hypothesisarrow_forward7. Question: The power of a test is measured by its capability of: a. Accepting a null hypothesis that is true. b. Rejecting a null hypothesis that is true. c. Rejecting the alternative hypothesis that is false. d. Rejecting a null hypothesis that is false. e. None of the mentioned.arrow_forwardState whether the standardized test statistic t indicates that you should reject the null hypothesis. Explain. (a) t = -2.272 (b) t = 2.154 (c) t = 2.303 (d) t= -2.301 -to = -2.226 to = 2.226arrow_forward
- Test the claim that the proportion of men who own cats is smaller than the proportion of women who own cats at the .025 significance level. The null and alternative hypothesis would be: Ho MMF Ho: PM = PF H₁: MMF O H₁: PM > PF O The test is: two-tailed right-tailed O The test statistic is: Based on a sample of 60 men, 25% owned cats Based on a sample of 40 women, 40% owned cats The p-value is: Ho: M = μF H₁: UMarrow_forwardAnswer these questions A, B, C and D questionarrow_forwardEspañol Try Again Your answer is incorrect. The proportion of residents in a community who recycle has traditionally been 65%. A policy maker claims that the proportion is less than 65 % now that one of the recycling centers has been relocated, and the policy maker wishses to carry out a hypothesis test. State the null hypothesis H, and the alternative hypothesis H, that the policy maker would use for this test. Ho: 0.65 Aa H: 0.65 S Oarrow_forward
- The P-value for a hypothesis test is shown. Use the P-value to decide whether to reject H, when the level of significance is (a) a = 0.01, (b) a = 0.05, and (c) a = 0.10. P= 0.0406 (a) Do you reject or fail to reject H, at the 0.01 level of significance? O A. Reject H, because the P-value, 0.0406, is less than a = 0.01. O B. Fail to reject H, because the P-value, 0.0406, is less than a = 0.01. OC. Reject H, because the P-value, 0.0406, is greater than a = 0.01. O D. Fail to reject H, because the P-value, 0.0406, is greater than a = 0.01. (b) Do you reject or fail to reject H, at the 0.05 level of significance? O A. Fail to reject H, because the P-value, 0.0406, is greater than a= 0.05. O B. Reject H, because the P-value, 0.0406, is less than a = 0.05. O C. Reject H, because the P-value, 0.0406, is greater than a = 0.05. O D. Fail to reject H, because the P-value, 0.0406, is less than a = 0.05. (c) Do you reject or fail to reject H, at the 0.10 level of significance? O A. Reject H,…arrow_forward- test the null hypothesis that the population mean, u is 14.arrow_forwardTest the claim that the proportion of people who own cats is significantly different than 80% at the 0.1 significance level. The alternative hypothesis would be: p 0.8 u > 0.8 µ < 0.8 p # 0.8 µ # 0.8 o The test is: left-tailed two-tailed right-tailed Based on a sample of 500 people, 75% owned cats The test statistic is: (to 2 decimals) The p-value is: (to 2 decimals)arrow_forward
arrow_back_ios
SEE MORE QUESTIONS
arrow_forward_ios
Recommended textbooks for you
- MATLAB: An Introduction with ApplicationsStatisticsISBN:9781119256830Author:Amos GilatPublisher:John Wiley & Sons Inc
 Probability and Statistics for Engineering and th...StatisticsISBN:9781305251809Author:Jay L. DevorePublisher:Cengage Learning
 Statistics for The Behavioral Sciences (MindTap C...StatisticsISBN:9781305504912Author:Frederick J Gravetter, Larry B. WallnauPublisher:Cengage Learning
  Elementary Statistics: Picturing the World (7th E...StatisticsISBN:9780134683416Author:Ron Larson, Betsy FarberPublisher:PEARSON
 The Basic Practice of StatisticsStatisticsISBN:9781319042578Author:David S. Moore, William I. Notz, Michael A. FlignerPublisher:W. H. Freeman
 Introduction to the Practice of StatisticsStatisticsISBN:9781319013387Author:David S. Moore, George P. McCabe, Bruce A. CraigPublisher:W. H. Freeman
MATLAB: An Introduction with Applications
Statistics
ISBN:9781119256830
Author:Amos Gilat
Publisher:John Wiley & Sons Inc
Probability and Statistics for Engineering and th...
Statistics
ISBN:9781305251809
Author:Jay L. Devore
Publisher:Cengage Learning
Statistics for The Behavioral Sciences (MindTap C...
Statistics
ISBN:9781305504912
Author:Frederick J Gravetter, Larry B. Wallnau
Publisher:Cengage Learning
Elementary Statistics: Picturing the World (7th E...
Statistics
ISBN:9780134683416
Author:Ron Larson, Betsy Farber
Publisher:PEARSON
The Basic Practice of Statistics
Statistics
ISBN:9781319042578
Author:David S. Moore, William I. Notz, Michael A. Fligner
Publisher:W. H. Freeman
Introduction to the Practice of Statistics
Statistics
ISBN:9781319013387
Author:David S. Moore, George P. McCabe, Bruce A. Craig
Publisher:W. H. Freeman