MATLAB: An Introduction with Applications
6th Edition
ISBN: 9781119256830
Author: Amos Gilat
Publisher: John Wiley & Sons Inc
expand_more
expand_more
format_list_bulleted
Question

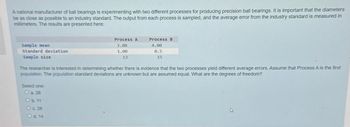
Transcribed Image Text:A national manufacturer of ball bearings is experimenting with two different processes for producing precision ball bearings. It is important that the diameters
be as close as possible to an industry standard. The output from each process is sampled, and the average error from the industry standard is measured in
millimeters. The results are presented here:
Sample mean
Standard deviation
Sample size
Select one:
O a. 26
O b. 11
Process A
3.00
1.00
13
The researcher is interested in determining whether there is evidence that the two processes yield different average errors. Assume that Process A is the first
population. The population standard deviations are unknown but are assumed equal. What are the degrees of freedom?
c. 28
O d. 14
Process B
4.00
0.5
15
Expert Solution
This question has been solved!
Explore an expertly crafted, step-by-step solution for a thorough understanding of key concepts.
This is a popular solution
Trending nowThis is a popular solution!
Step by stepSolved in 3 steps with 1 images

Knowledge Booster
Similar questions
- The next five questions refer to the following scenario: • sample mean T = 10 • sample size n = 100 • population standard deviation O = 4arrow_forwardFind mean & standard deviation using table: X Frequency 2 20% 5 10% 8 15% 10 30% 12 25% For the mean, i get 7.4 & 20%. Std dev i get 4.459362. Just wanted to check my numbers.arrow_forwardThe type of household for the U.S. population and for a random sample of 411 households from a community in Montana are shown below. Type of Household Percent of U.S.Households Observed Numberof Households inthe Community Married with children 26% 92 Married, no children 29% 121 Single parent 9% 31 One person 25% 102 Other (e.g., roommates, siblings) 11% 65 A) Find the value of the chi-square statistic for the sample. (Round the expected frequencies to two decimal places. Round the test statistic to three decimal places.) B)Find or estimate the P-value of the sample test statistic. (Round your answer to three decimal places.)arrow_forward
- Estimate the distance traveled in 20 seconds given the following sample velocities using right- endpoint values. Be sure to write the units for your answer. Time (s) 10 15 20 Velocity (m/s) 3 3.4 2.9 2.4 1arrow_forwardFor the sample data set from HW M0 Problem 1: (92, 97, 88, 91, 94, 94, 85, 93, 81, 85) perform the following calculations or operations with pencil and paper: 1. Estimate the standard deviation from the range using the d2 method2. Determine the quartiles.3. Calculate the IQR. 4.Calculate boxplot 5. Sketch a stem and leaf plot.arrow_forwardIn this problem, assume that the distribution of differences is approximately normal. Note: For degrees of freedom d.f. not in the Student's t table, use the closest d.f. that is smaller. In some situations, this choice of d.f. may increase the P-value by a small amount and therefore produce a slightly more "conservative" answer.In the following data pairs, A represents birth rate and B represents death rate per 1000 resident population. The data are paired by counties in the Midwest. A random sample of 16 counties gave the following information. A: 12.5 13.2 12.6 12.1 11.4 11.1 14.2 15.1 B: 9.6 14.3 10.7 14.2 13.2 12.9 10.9 10.0 A: 12.5 12.3 13.1 15.8 10.3 12.7 11.1 15.7 B: 14.1 13.6 9.1 10.2 17.9 11.8 7.0 9.2arrow_forward
arrow_back_ios
arrow_forward_ios
Recommended textbooks for you
 MATLAB: An Introduction with ApplicationsStatisticsISBN:9781119256830Author:Amos GilatPublisher:John Wiley & Sons Inc
 Probability and Statistics for Engineering and th...StatisticsISBN:9781305251809Author:Jay L. DevorePublisher:Cengage Learning
 Statistics for The Behavioral Sciences (MindTap C...StatisticsISBN:9781305504912Author:Frederick J Gravetter, Larry B. WallnauPublisher:Cengage Learning
 Elementary Statistics: Picturing the World (7th E...StatisticsISBN:9780134683416Author:Ron Larson, Betsy FarberPublisher:PEARSON
 The Basic Practice of StatisticsStatisticsISBN:9781319042578Author:David S. Moore, William I. Notz, Michael A. FlignerPublisher:W. H. Freeman
 Introduction to the Practice of StatisticsStatisticsISBN:9781319013387Author:David S. Moore, George P. McCabe, Bruce A. CraigPublisher:W. H. Freeman

MATLAB: An Introduction with Applications
Statistics
ISBN:9781119256830
Author:Amos Gilat
Publisher:John Wiley & Sons Inc

Probability and Statistics for Engineering and th...
Statistics
ISBN:9781305251809
Author:Jay L. Devore
Publisher:Cengage Learning

Statistics for The Behavioral Sciences (MindTap C...
Statistics
ISBN:9781305504912
Author:Frederick J Gravetter, Larry B. Wallnau
Publisher:Cengage Learning

Elementary Statistics: Picturing the World (7th E...
Statistics
ISBN:9780134683416
Author:Ron Larson, Betsy Farber
Publisher:PEARSON

The Basic Practice of Statistics
Statistics
ISBN:9781319042578
Author:David S. Moore, William I. Notz, Michael A. Fligner
Publisher:W. H. Freeman

Introduction to the Practice of Statistics
Statistics
ISBN:9781319013387
Author:David S. Moore, George P. McCabe, Bruce A. Craig
Publisher:W. H. Freeman