
MATLAB: An Introduction with Applications
6th Edition
ISBN: 9781119256830
Author: Amos Gilat
Publisher: John Wiley & Sons Inc
expand_more
expand_more
format_list_bulleted
Related questions
Question
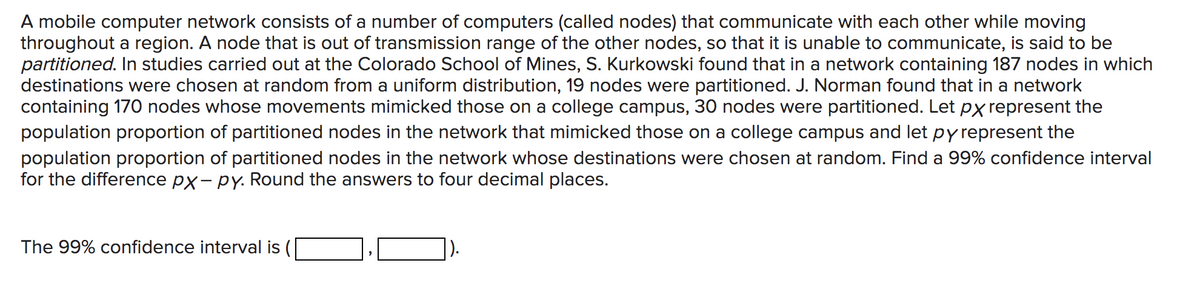

Transcribed Image Text:A mobile computer network consists of a number of computers (called nodes) that communicate with each other while moving
throughout a region. A node that is out of transmission range of the other nodes, so that it is unable to communicate, is said to be
partitioned. In studies carried out at the Colorado School of Mines, S. Kurkowski found that in a network containing 187 nodes in which
destinations were chosen at random from a uniform distribution, 19 nodes were partitioned. J. Norman found that in a network
containing 170 nodes whose movements mimicked those on a college campus, 30 nodes were partitioned. Let px represent the
population proportion of partitioned nodes in the network that mimicked those on a college campus and let py represent the
population proportion of partitioned nodes in the network whose destinations were chosen at random. Find a 99% confidence interval
for the difference px-py. Round the answers to four decimal places.
The 99% confidence interval is (
'
).
Expert Solution
This question has been solved!
Explore an expertly crafted, step-by-step solution for a thorough understanding of key concepts.

Step by stepSolved in 2 steps

Knowledge Booster

Similar questions
- A network provider investigates the load of its network. The number of concurrent users isrecorded at forty locations (thousands of people),17.2 22.1 18.5 17.2 18.6 14.8 21.7 15.8 16.3 22.824.1 13.3 16.2 17.5 19.0 23.9 14.8 22.2 21.7 20.713.5 15.8 13.1 16.1 21.9 23.9 19.3 12.0 19.9 19.415.4 16.7 19.5 16.2 16.9 17.1 20.2 13.4 19.8 17.7It is reported that the number of concurrent users follows approximately Normaldistribution. Construct the histogram to verify this claim.arrow_forwardIn an effort to inform political leaders and economists discussing the deregulation of electric and gas utilities, data on eight numerical variables from utility companies have been grouped using hierarchical clustering based on Euclidean distance to measure dissimilarity between observations and complete linkage as the agglomeration method. (a) Based on the following dendrogram, what is the most appropriate number of clusters to organize these utility companies? 6.5 6.0 5.5 5.0 4.5 4.0 3.5 Between-Cluster Distance 3.0 2.577 2.5 2.0 1.5 1.0 0.5 10 13 4 20 2 21 5 1 18 14 19 6 3 9 7 12 15 17 8 16 11 Cluster clusters are appropriate based on complete linkage. 4 Distancearrow_forwardIn order to study the spending habits of shoppers in Orlando, Florida, 50 randomly selected shoppers at amall were surveyed to determine the number of credit cards they carried. The following results were obtained:6 5 0 4 5 1 1 6 3 5 4 3 3 64 2 5 2 0 2 5 0 5 5 2 5 2 35 0 4 0 6 3 6 3 4 0 6 2 3 42 5 1 0 4 2 4 3Complete the frequency distribution table, and calculate the relative frequency of each number of cards.Construct a pie chart to represent the data.arrow_forward
- A market with 168 operating firms has the following distribution of average number of workers in various income groups: Income groups : 150-300 300-500 500-800 800-1200 1200-1800 No. of firms : 40 32 26 28 42 Average No. of workers : 8 12 7.5 8.5 4 Find the average salary paid in the whole market.arrow_forward3) The following two sets of Excel output use are from the same data set as described above, but the first set of output is for the set of 35 CEO’s that earn the lowest total compensation and the second set of output is for a set of 40 CEO’s that earn the highest total compensation. a) What is heteroscedasticity? b) Why is heteroscedasticity a problem? c) Based on a comparison of the two sets of output, does it appear that there is heteroscedasticity in the data set? Explain.arrow_forwardA group of veterinarians at a major veterinary hospital was interested in investigating a possible link between enteroliths, stones that form in the colon of horses, and diet. They decided to conduct a survey of feeding practices of horses in the hospital's state. They created a survey questionnaire and decided to administer it to the owners of every fifth horse being treated at the hospital. The population of interest is: A)all horses in the state. b) all horses that are diagnosed with enteroliths. C) None of the answer choices is correct. D)all horses brought to the clinic.arrow_forward
arrow_back_ios
arrow_forward_ios
Recommended textbooks for you
- MATLAB: An Introduction with ApplicationsStatisticsISBN:9781119256830Author:Amos GilatPublisher:John Wiley & Sons Inc
 Probability and Statistics for Engineering and th...StatisticsISBN:9781305251809Author:Jay L. DevorePublisher:Cengage Learning
 Statistics for The Behavioral Sciences (MindTap C...StatisticsISBN:9781305504912Author:Frederick J Gravetter, Larry B. WallnauPublisher:Cengage Learning
  Elementary Statistics: Picturing the World (7th E...StatisticsISBN:9780134683416Author:Ron Larson, Betsy FarberPublisher:PEARSON
 The Basic Practice of StatisticsStatisticsISBN:9781319042578Author:David S. Moore, William I. Notz, Michael A. FlignerPublisher:W. H. Freeman
 Introduction to the Practice of StatisticsStatisticsISBN:9781319013387Author:David S. Moore, George P. McCabe, Bruce A. CraigPublisher:W. H. Freeman
MATLAB: An Introduction with Applications
Statistics
ISBN:9781119256830
Author:Amos Gilat
Publisher:John Wiley & Sons Inc
Probability and Statistics for Engineering and th...
Statistics
ISBN:9781305251809
Author:Jay L. Devore
Publisher:Cengage Learning
Statistics for The Behavioral Sciences (MindTap C...
Statistics
ISBN:9781305504912
Author:Frederick J Gravetter, Larry B. Wallnau
Publisher:Cengage Learning
Elementary Statistics: Picturing the World (7th E...
Statistics
ISBN:9780134683416
Author:Ron Larson, Betsy Farber
Publisher:PEARSON
The Basic Practice of Statistics
Statistics
ISBN:9781319042578
Author:David S. Moore, William I. Notz, Michael A. Fligner
Publisher:W. H. Freeman
Introduction to the Practice of Statistics
Statistics
ISBN:9781319013387
Author:David S. Moore, George P. McCabe, Bruce A. Craig
Publisher:W. H. Freeman