MATLAB: An Introduction with Applications
6th Edition
ISBN: 9781119256830
Author: Amos Gilat
Publisher: John Wiley & Sons Inc
expand_more
expand_more
format_list_bulleted
Question
A meteorologist relocated to the city of Windhoek and decided to carry out a research on the
amount of rainfall a month recorded in the city in a particular year. His data contained the
following:
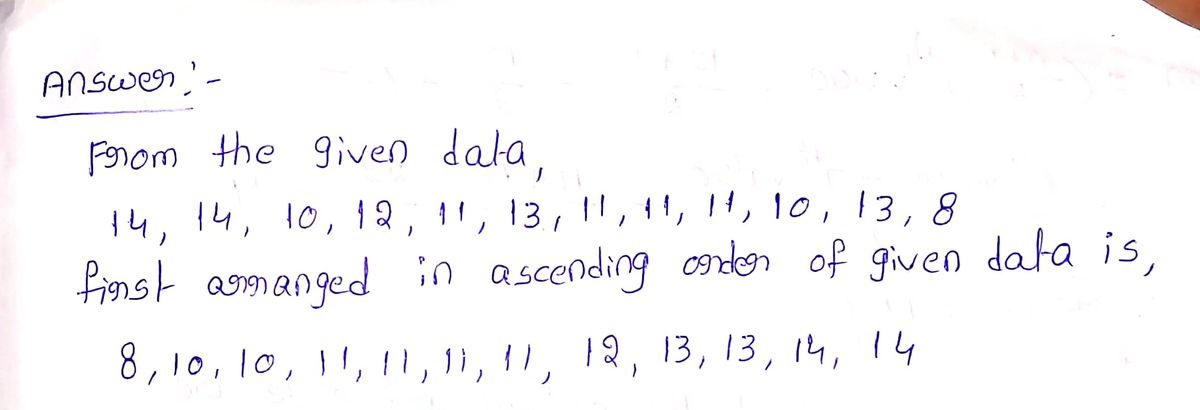
14 14 10 12 11 13 11 11 11 10 13 8
a. Use the data to calculate the Mean,
b. Interpret each central measure
Expert Solution
arrow_forward
Step 1

Step by stepSolved in 3 steps with 3 images

Knowledge Booster
Similar questions
- Consider the following ordered data. 4 7 7 8 9 9 10 11 12 Find the low, Q1, median, Q3, and high Find the interquartile rangearrow_forwardFor which measure of center must the data be ranked? A. Mode B. Standard Deviation C. Median D. Meanarrow_forwardDraw a box plot for the following data: Median: 4.5 Lowest Value: 1 Greatest Value: 9 Lower Quartile: 2.5 Interquartile Range: 6 8 10arrow_forward
- Consider the following partially filled frequency table: Value Frequency 0.5 1.0 2.9 Calculate the mean (to 2 d.p.). Cumulative Relative Frequency Frequency 0.2 39 100arrow_forwardThe following frequency table summarizes a set of data. What is the five-number summary? Value Frequency 2 3 3 2 5 1 6 3 7 1 8 2 11 3arrow_forwardFind the mean of the data summarized in the given frequency distribution. Compare the computed mean to the actual mean of 58.1 degrees. Which of the following best describes the relationship between the computed mean and the actual mean? Low Temperature (◦F) 40−44 45−49 50−54 55−59 60−64 Frequency 2 6 11 6 3arrow_forward
- Interpret scatter diagram and descriptive statistics.arrow_forwardDetermine which of the four levels of measurement ( norminal, ordinal, interval, ratio) is most appropriate for the data below. Years in which U.S. presidents were inauguratedarrow_forwardComplete the following frequency chart.A frequency chart of temperatures Temperature Frequency Relative Frequency 70 - 74 75 - 79 80 - 84 85 - 89 90 - 94 From the frequency chart, calculate the mean. How does the mean from the raw data (question 7) compare to the mean from the grouped data (question 9)? Use the frequency chart to create a histogram of the daily high temperatures at Cox-Dayton International Airport for June and July 2018. Describe the distribution by shape, center, and spread. Also, state whether there are any outliers.arrow_forward
- Answer for b c darrow_forwardListed below are the measured radiation emissions (in W/kg) corresponding to cell phones: A, B, C, D, E, F, G, H, I, J, and K respectively. The media often present reports about the dangers of cell phone radiation as a cause of cancer. Cell phone radiation must be 1.6 W/kg or less. Find the a. mean, b. median, c. midrange, and d. mode for the data. Also complete part e. 0.45 0.77 0.72 0.68 1.53 1.28 0.75 0.99 0.55 0.56 1.12 --..- a. Find the mean. The mean is . (Round to three decimal places as needed.)arrow_forward
arrow_back_ios
arrow_forward_ios
Recommended textbooks for you
 MATLAB: An Introduction with ApplicationsStatisticsISBN:9781119256830Author:Amos GilatPublisher:John Wiley & Sons Inc
 Probability and Statistics for Engineering and th...StatisticsISBN:9781305251809Author:Jay L. DevorePublisher:Cengage Learning
 Statistics for The Behavioral Sciences (MindTap C...StatisticsISBN:9781305504912Author:Frederick J Gravetter, Larry B. WallnauPublisher:Cengage Learning
 Elementary Statistics: Picturing the World (7th E...StatisticsISBN:9780134683416Author:Ron Larson, Betsy FarberPublisher:PEARSON
 The Basic Practice of StatisticsStatisticsISBN:9781319042578Author:David S. Moore, William I. Notz, Michael A. FlignerPublisher:W. H. Freeman
 Introduction to the Practice of StatisticsStatisticsISBN:9781319013387Author:David S. Moore, George P. McCabe, Bruce A. CraigPublisher:W. H. Freeman

MATLAB: An Introduction with Applications
Statistics
ISBN:9781119256830
Author:Amos Gilat
Publisher:John Wiley & Sons Inc

Probability and Statistics for Engineering and th...
Statistics
ISBN:9781305251809
Author:Jay L. Devore
Publisher:Cengage Learning

Statistics for The Behavioral Sciences (MindTap C...
Statistics
ISBN:9781305504912
Author:Frederick J Gravetter, Larry B. Wallnau
Publisher:Cengage Learning

Elementary Statistics: Picturing the World (7th E...
Statistics
ISBN:9780134683416
Author:Ron Larson, Betsy Farber
Publisher:PEARSON

The Basic Practice of Statistics
Statistics
ISBN:9781319042578
Author:David S. Moore, William I. Notz, Michael A. Fligner
Publisher:W. H. Freeman

Introduction to the Practice of Statistics
Statistics
ISBN:9781319013387
Author:David S. Moore, George P. McCabe, Bruce A. Craig
Publisher:W. H. Freeman