MATLAB: An Introduction with Applications
6th Edition
ISBN: 9781119256830
Author: Amos Gilat
Publisher: John Wiley & Sons Inc
expand_more
expand_more
format_list_bulleted
Question

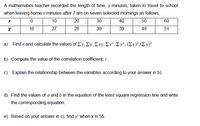
Transcribed Image Text:A mathematics teacher recorded the length of time, y minutes, taken to travel to school
when leaving home x minutes after 7 am on seven selected mornings as follows.
10
20
30
40
50
60
y
16
27
28
39
39
48
51
a) Find nand calculate the values of Σ x, Σy, Σxν, Σx3, Σν", (Σx)?,(Σ ν)
b) Compute the value of the correlation coefficient, r.
c) Explain the relationship between the variables according to your answer in b).
d) Find the values of a and b in the equation of the least square regression line and write
the corresponding equation.
e) Based on your answer in c), find y' when x is 55.
Expert Solution
This question has been solved!
Explore an expertly crafted, step-by-step solution for a thorough understanding of key concepts.
This is a popular solution
Trending nowThis is a popular solution!
Step by stepSolved in 4 steps

Knowledge Booster
Similar questions
- The data show the time intervals after an eruption (to the next eruption) of a certain geyser. x (Height in ft.) 136 113 148 118 145 117 112 141 y (Interval after in min.) 91 85 95 88 89 85 87 90 a. Find the value of the linear correlation coefficient: r = nothing (Round to three decimal places as needed.) b. Find the critical value for determining if there is a linear relationship in the population of all eruptions (use alpha equals 0.05 ): Critical value = nothing (Round to three decimal places as needed.) c. Is there a linear correlation between height and interval in the population of all eruptions? A. No B. Yes d. What is the regression equation that gives the interval in terms of the height? yequals nothingplusnothing x (Round to three decimal places as needed.) e. Find the best predicted time of the interval after an eruption given that the current eruption has a height of…arrow_forwardWhich of the following choices could be the Pearson correlation between the x and y variables shown in the scatter plot shown here? a) .934 b) -.934 c) 1 d) 0arrow_forwardMatch each correlation value with its interpretation A. large (strong) negative relationship B. small (weak) positive relationship C. large (strong) positive relationship select 1.r -0.8 select 2.r 0.1 select 3. r = 0.7 7,821 MAR 20 F3 F2 D00 F4 F5 F6 F7 $ % & 4 6 LA 00 %#3arrow_forward
- Determine which plot shows the strongest linear correlation. S OA. 7 X 4 4 H O C. # 3 80 F3 E D C $ 4 R F % 5 V T G 6 MacBook Air B FO Y H & 7 U N OB. OD. * 8 J DII 1 0 46 M ( 9 YA O K DD F9 O ) < 20 O 1 L F10 Time Remaining: 01:59:07 P .v command .... 6 FI I { [ ? option 1 Next ] darrow_forwardWhich of the following best describes the relationship between the variables on the scatter plot below? 11 10 15 4 3. 2 1 1234 56 7 8 9 10 11 12 13 O A. linear association OB. no association OC. non-linear association OD. linear and non-linear associationarrow_forwardPage 34 Compute the correlation coe cient, r, for the following table: X 10 y 5 12 15 16 1 4 6 18 1 9 7 8 1 25 12 14 17 3 6arrow_forward
arrow_back_ios
arrow_forward_ios
Recommended textbooks for you
 MATLAB: An Introduction with ApplicationsStatisticsISBN:9781119256830Author:Amos GilatPublisher:John Wiley & Sons Inc
 Probability and Statistics for Engineering and th...StatisticsISBN:9781305251809Author:Jay L. DevorePublisher:Cengage Learning
 Statistics for The Behavioral Sciences (MindTap C...StatisticsISBN:9781305504912Author:Frederick J Gravetter, Larry B. WallnauPublisher:Cengage Learning
 Elementary Statistics: Picturing the World (7th E...StatisticsISBN:9780134683416Author:Ron Larson, Betsy FarberPublisher:PEARSON
 The Basic Practice of StatisticsStatisticsISBN:9781319042578Author:David S. Moore, William I. Notz, Michael A. FlignerPublisher:W. H. Freeman
 Introduction to the Practice of StatisticsStatisticsISBN:9781319013387Author:David S. Moore, George P. McCabe, Bruce A. CraigPublisher:W. H. Freeman

MATLAB: An Introduction with Applications
Statistics
ISBN:9781119256830
Author:Amos Gilat
Publisher:John Wiley & Sons Inc

Probability and Statistics for Engineering and th...
Statistics
ISBN:9781305251809
Author:Jay L. Devore
Publisher:Cengage Learning

Statistics for The Behavioral Sciences (MindTap C...
Statistics
ISBN:9781305504912
Author:Frederick J Gravetter, Larry B. Wallnau
Publisher:Cengage Learning

Elementary Statistics: Picturing the World (7th E...
Statistics
ISBN:9780134683416
Author:Ron Larson, Betsy Farber
Publisher:PEARSON

The Basic Practice of Statistics
Statistics
ISBN:9781319042578
Author:David S. Moore, William I. Notz, Michael A. Fligner
Publisher:W. H. Freeman

Introduction to the Practice of Statistics
Statistics
ISBN:9781319013387
Author:David S. Moore, George P. McCabe, Bruce A. Craig
Publisher:W. H. Freeman