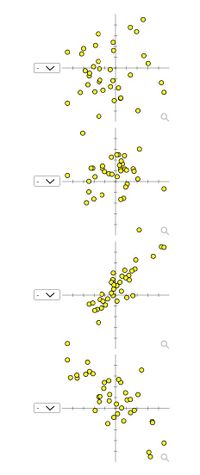
Match each scatterplot shown below with one of the four specified
a. 0.07
b. 0.89
c. -0.07
d. -0.72

The value r= 0, confirms the lack of linear association between two variables. In this case, all the points are scattered on a graph and hardly any three points lie in a straight line.
If r= 1, it means that Y is proportional to X which ensures perfect positive linear association. In this case all points in a scatter diagram lie on a straight line extending from left bottom to the right top. It means as X increases, Y also increases.
If r= -1, it means as X increases, Y decreases. This ensures perfect negative association. In this situation Y is proportional to 1/x. All the points lie on a straight line extending from left top to the right bottom.
Trending nowThis is a popular solution!
Step by stepSolved in 3 steps

- Match each scatterplot shown below with one of the four specified correlations. O O ∞oo O oooº 0000 8 9088 08 8 a. -0.89 b. -0.12 c. 0.55 d. 0.98arrow_forwardThe correlation between midterm and final grades for 300 students is 0.620. If 5 points are added to each midterm grade, the new r will be: a. 0.124 b. 0.57 c. 0.62 d. 0.744arrow_forwardMatch each correlation value with its interpretation A. large (strong) negative relationship B. small (weak) positive relationship C. large (strong) positive relationship select 1.r -0.8 select 2.r 0.1 select 3. r = 0.7 7,821 MAR 20 F3 F2 D00 F4 F5 F6 F7 $ % & 4 6 LA 00 %#3arrow_forward
- Which of the R values below is consistent with a "perfect" correlation? a. 0.0 b. 0.5 c. -1.0 d. 0.95arrow_forwardDr. Wabld Hamdy given by the following table: y X-4 -2 2 4 --2 0 0.25 0 0 -100 0.25 1 0.25 00 0 2 0.25 0 Find the correlation coefficient between X and Y llu mad and imported automobiles soldarrow_forwardGiven the table below, use your calculator to find the Correlation Coefficient xx 7.1 9.6 8.9 4.5 2.9 4.4 yy 17.9 25 22.4 18.6 12.3 15.9arrow_forward
- Which of the following correlation coefficients might lead a researcher to conclude that there is a weak, but significant, negative linear relation between variables X and Y? a. r=0.99 b. r=0.30 c. r=0 d. r=-0.30 c. r=-0.99arrow_forwardfrom the following data, find Spearman correlation coefficient : X 50 60 55 43 y 9 8 8 6 86 5 91 4arrow_forwardMarks secured by elevan students in two subjects are given below : Subject I Subject II : 69 64 65 63 65 62 65 64 66 59 62 Find the coefficient of correlation. : 71 68 66 67 70 71 70 73 72 65 66arrow_forward
- calculate the correlation coefficient to three decimal places, x is 4,5,6,7,8,9, y, 6.05,8.64,3.93,4.92,2.31,4arrow_forwardCalculate Coefficient of Correlation from the following data: 0.1 0.2 0.3 0.4 0.5 0.6 0.7 y 30,000 50,000 60.000 80,000 1.00,000 1,10,000 1.30,000arrow_forwardWhich number below is representative of the largest correlation? r = -0.75 r = .05 r = -0.45 r = 0.65arrow_forward
 MATLAB: An Introduction with ApplicationsStatisticsISBN:9781119256830Author:Amos GilatPublisher:John Wiley & Sons Inc
 Probability and Statistics for Engineering and th...StatisticsISBN:9781305251809Author:Jay L. DevorePublisher:Cengage Learning
 Statistics for The Behavioral Sciences (MindTap C...StatisticsISBN:9781305504912Author:Frederick J Gravetter, Larry B. WallnauPublisher:Cengage Learning
 Elementary Statistics: Picturing the World (7th E...StatisticsISBN:9780134683416Author:Ron Larson, Betsy FarberPublisher:PEARSON
 The Basic Practice of StatisticsStatisticsISBN:9781319042578Author:David S. Moore, William I. Notz, Michael A. FlignerPublisher:W. H. Freeman
 Introduction to the Practice of StatisticsStatisticsISBN:9781319013387Author:David S. Moore, George P. McCabe, Bruce A. CraigPublisher:W. H. Freeman


