MATLAB: An Introduction with Applications
6th Edition
ISBN: 9781119256830
Author: Amos Gilat
Publisher: John Wiley & Sons Inc
expand_more
expand_more
format_list_bulleted
Question

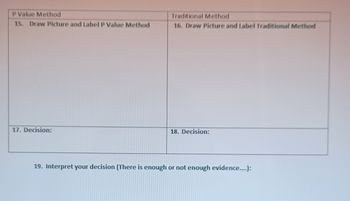
Transcribed Image Text:P Value Method
15. Draw Picture and Label P Value Method
17. Decision:
Traditional Method
16. Draw Picture and Label Traditional Method
18. Decision:
19. Interpret your decision (There is enough or not enough evidence....):

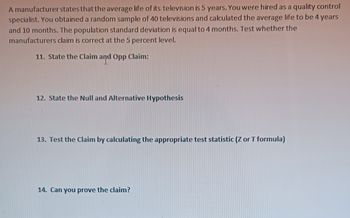
Transcribed Image Text:A manufacturer states that the average life of its television is 5 years. You were hired as a quality control
specialist. You obtained a random sample of 40 televisions and calculated the average life to be 4 years
and 10 months. The population standard deviation is equal to 4 months. Test whether the
manufacturers claim is correct at the 5 percent level.
11. State the Claim and Opp Claim:
12. State the Null and Alternative Hypothesis
13. Test the Claim by calculating the appropriate test statistic (Z or T formula)
14. Can you prove the claim?
Expert Solution
This question has been solved!
Explore an expertly crafted, step-by-step solution for a thorough understanding of key concepts.
Step by stepSolved in 3 steps with 7 images

Knowledge Booster
Similar questions
- We are planning on performing a study to determine the average age of online students at NCC. We would like to be 99% confident in our answer and we would like to be within 2 years of the actual age. A previous study determined that the standard deviation was approximately 7.5 years. How many students must we sample?arrow_forwardAs Director of Admissions at Garden Valley University, you believe that the average age of full-time students (Group 1) is less than the average age of part-time students (Group 2). You sample 45 full-time students, and the sample mean age is 22.3 with a standard deviation of 4.8. You sample 50 part-time students, and the sample mean age is 24.3 with a standard deviation of 5.6. Test the claim using a 2% level of significance. Assume the population standard deviations are unequal and that both populations are normally distributed. Where necessary, round results accurate to 4 decimal places. a. What are the correct hypotheses? Null: Ο Ho: μ = 0 O Ho: ₁ = ₂ Ho: M₁ M₂ Ο Ho: μ = 22.3 Alternative: Ο HA: Mı # με Ο HA: μ. > με HA: ₁2 HA: < 0 Ο HA: μ + 22.3 b. What is the correct distribution to use for the test? Select an answer c. What is the test statistic? d. What is the p-value? p-value = e. The correct decision is to Select an answer f. INTERPRET the conclusion in the context of the…arrow_forwardA random sample of 49 cans of soda is obtained and the contents are measured. The sample mean is 12.01 oz and the standard deviation is 0.13 oz. Test the claim that the contents of all such cans have a mean different from 12.00 oz, as indicated by the label. Use a 0.05 significance level. Find the Z score And the P value. Do you reject the hypothesis?arrow_forward
- An IQ test is designed so that the mean is 100 and the standard deviation is 13 for the population of normal adults. Find the sample size necessary to estimate the mean IQ score of statistics students such that it can be said with 95% confidence that the sample mean is within 6 IQ points of the true mean. Assume that o = 13 and determine the required sample size using technology. Then determine if this is a reasonable sample size for a real world calculation. ..... The required sample size is. (Round up to the nearest integer.)arrow_forwardThe director of research and development is testing a new drug. She wants to know if there is evidence at the 0.05 level that the drug stays in the system for more than 352 minutes. For a sample of 54 patients the mean time the drug stayed in the system was 360 minutes. Assume the population standard deviation is 25. Find the p-value of the test statisticarrow_forwardThe Chancellor wants you to calculate the sample size needed with a margin of error of 15, 99% confidence, and a population standard deviation of 22.arrow_forward
- The mean cholesterol level for females in a population is 200 with a standard deviation of 25. Samples of size 64 are drawn from the population. A. What is the mean of the sample means? B. What is the standard error of the sample means?arrow_forwardA bottled water distributor wants to determine whether the mean amount of water contained in 1-gallon bottles purchased from a nationally known water bottling company is actually 1 gallon. You know from the water bottling company specifications that the standard deviation of the amount of water is 0.02 gallon. You select a random sample of 50 bottles, and the mean amount of water per 1-gallon bottle is 0.992 gallon. What is the test statistic?arrow_forwardHistorically, the mean age of all Memphis residents has been 40 years. You believe this has changed. You take a random sample of 130 Memphis residents and find that their mean age is 36 years with a standard deviation of 17 years. Can you conclude that the mean age of all Memphis residents has changed from 40 years. For the hypothesis testing scenario above, compute the test statistic. For the hypothesis testing scenario above, you conclude that the mean age of all Memphis residents has changed from 40 years at the 0.05 significance level. Compute the 95% confidence interval to estimate the mean age of all Memphis residents.arrow_forward
arrow_back_ios
arrow_forward_ios
Recommended textbooks for you
 MATLAB: An Introduction with ApplicationsStatisticsISBN:9781119256830Author:Amos GilatPublisher:John Wiley & Sons Inc
 Probability and Statistics for Engineering and th...StatisticsISBN:9781305251809Author:Jay L. DevorePublisher:Cengage Learning
 Statistics for The Behavioral Sciences (MindTap C...StatisticsISBN:9781305504912Author:Frederick J Gravetter, Larry B. WallnauPublisher:Cengage Learning
 Elementary Statistics: Picturing the World (7th E...StatisticsISBN:9780134683416Author:Ron Larson, Betsy FarberPublisher:PEARSON
 The Basic Practice of StatisticsStatisticsISBN:9781319042578Author:David S. Moore, William I. Notz, Michael A. FlignerPublisher:W. H. Freeman
 Introduction to the Practice of StatisticsStatisticsISBN:9781319013387Author:David S. Moore, George P. McCabe, Bruce A. CraigPublisher:W. H. Freeman

MATLAB: An Introduction with Applications
Statistics
ISBN:9781119256830
Author:Amos Gilat
Publisher:John Wiley & Sons Inc

Probability and Statistics for Engineering and th...
Statistics
ISBN:9781305251809
Author:Jay L. Devore
Publisher:Cengage Learning

Statistics for The Behavioral Sciences (MindTap C...
Statistics
ISBN:9781305504912
Author:Frederick J Gravetter, Larry B. Wallnau
Publisher:Cengage Learning

Elementary Statistics: Picturing the World (7th E...
Statistics
ISBN:9780134683416
Author:Ron Larson, Betsy Farber
Publisher:PEARSON

The Basic Practice of Statistics
Statistics
ISBN:9781319042578
Author:David S. Moore, William I. Notz, Michael A. Fligner
Publisher:W. H. Freeman

Introduction to the Practice of Statistics
Statistics
ISBN:9781319013387
Author:David S. Moore, George P. McCabe, Bruce A. Craig
Publisher:W. H. Freeman