
MATLAB: An Introduction with Applications
6th Edition
ISBN: 9781119256830
Author: Amos Gilat
Publisher: John Wiley & Sons Inc
expand_more
expand_more
format_list_bulleted
Related questions
Question
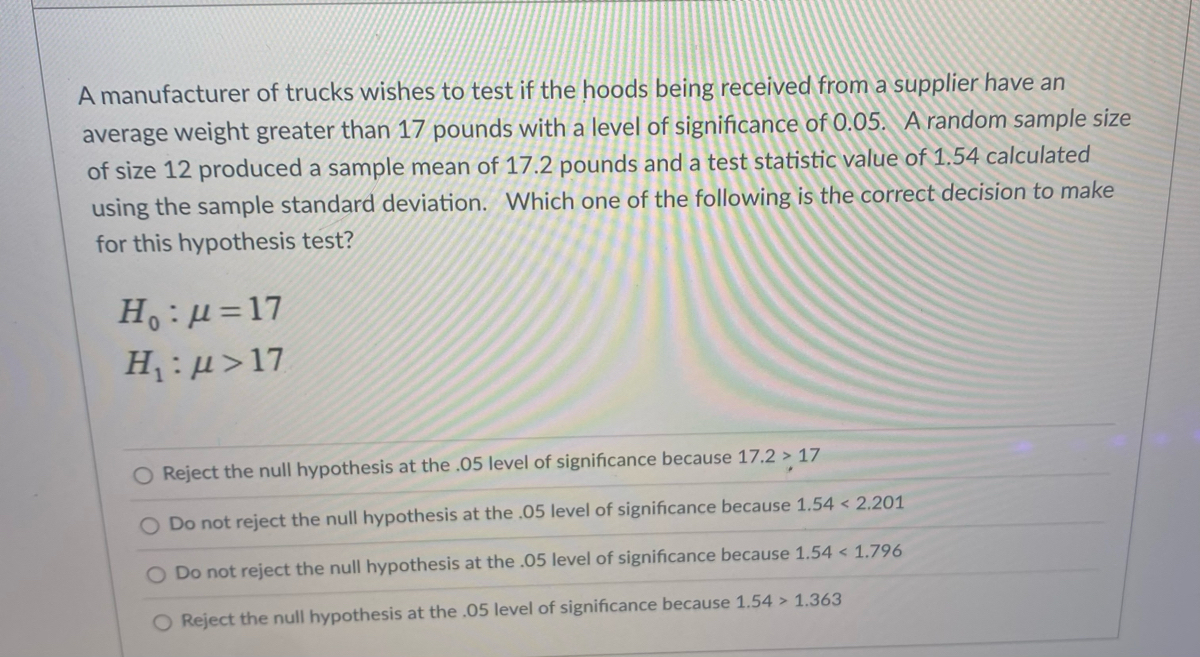

Transcribed Image Text:A manufacturer of trucks wishes to test if the hoods being received from a supplier have an
average weight greater than 17 pounds with a level of significance of 0.05. A random sample size
of size 12 produced a sample mean of 17.2 pounds and a test statistic value of 1.54 calculated
using the sample standard deviation. Which one of the following is the correct decision to make
for this hypothesis test?
H:µ=17
H :µ>17
Reject the null hypothesis at the .05 level
significance because 17.2 > 17
O Do not reject the null hypothesis at the .05 level of significance because 1.54 < 2.201
O Do not reject the null hypothesis at the .05 level of significance because 1.54 < 1.796
O Reject the null hypothesis at the .05 level of significance because 1.54 > 1.363
Expert Solution
This question has been solved!
Explore an expertly crafted, step-by-step solution for a thorough understanding of key concepts.

Step by stepSolved in 2 steps with 2 images

Knowledge Booster

Similar questions
- A researcher is interested in seeing if the average income of rural families is less than that of urban families. To see if his claim is correct he randomly selects 23 families from a rural area and finds that they have an average income of $69033 with a standard deviation of $591. He then selects 24 families from a urban area and finds that they have an average income of $65076 with a standard deviation of $846. Perform a hypothesis test using a significance level of 0.01 to help him decide. Let the rural families be sample 1 and the urban families be sample 2. The correct hypotheses are: Ho:µ1 µ2(claim) Ho: µ1 2 µ2 HA: H1 < H2(claim) Ho: µ1 = µ2 HA:µ1 # µ2(claim) Since the level of significance is 0.01 the critical value is -2.42 The test statistic is: (round to 3 places) The p-value is: (round to 3 places)arrow_forwardAccording to the College Board, scores on the math section of the SAT Reasoning college entrance test for the class of 2010 had a mean of 516 and a standard deviation of 116. Assume that they are roughly normal.One of the quartiles of the scores from the math section of the SAT Reasoning test is 438. The other quartile is _______.arrow_forwardJustine is an analyst for a sleep study center. She believes that the average adult in a certain city spends more than 7.2 hours sleeping daily. To test this claim, she selects a random sample of 63 adults from the city. The following is the data from this study: The alternative hypothesis Ha:μ>7.2. The sample mean number of hours slept per night by the 63 adults is 7.52 hours. The sample standard deviation is 1.14 hours. The test statistic is calculated as 2.23. Using the information above and the portion of the t− table below, choose the correct p− value and interpretation for this hypothesis test. Values for right-tail areas under the t-distribution curve Probability 0.10 0.05 0.025 0.01 0.005 Degrees of Freedom 60 1.296 1.671 2.000 2.390 2.660 61 1.296 1.670 2.000 2.389 2.659 62 1.295 1.670 1.999 2.388 2.657 63 1.295 1.669 1.998 2.387 2.656 64 1.295 1.669 1.998 2.386 2.655 65 1.295 1.669 1.997 2.385 2.654 66 1.295 1.668 1.997 2.384 2.652…arrow_forward
- Use the following scenario to answer the next 6 questions. An engineer has designed a valve that will regulate water pressure on an automobile engine. The valve was tested on 30 engines and the mean pressure was 4.8 psi with a standard deviation of 1 psi. If the valve was designed to produce an overall mean pressure of 5.0 psi, is there sufficient evidence at the 10% level of significance that the valve performs below specifications? The appropriate hypothesis test for this scenario is: Group of answer choices right-tailed two-tailed left-tailedarrow_forwardYou are a manager of a building that hosts the local farmers market for a town. You want to investigate if the average amount of sales for a vendor per week at your building is greater than $2040. After surveying 17 of their vendors, you find that mean sales per week of the vendors sampled was $2110 with a standard deviation of $114.03. What is the value of the test statistic for your hypothesis test? Note: 1- Only round your final answer. Round your final answer to two decimal places.arrow_forwardA manufacturer of potato chips would like to know whether its bag filling machine works correctly at the 433 gram setting. It is believed that the machine is underfilling or overfilling the bags. A 11 bag sample had a mean of 428 grams with a standard deviation of 26. Assume the population normally distributed. A level of significance of 0.05 will be used. Specify the type of hypothesis test.arrow_forward
- The coach of a very popular men’s basketball team claims that the average distance the fans travel to the campus to watch a game is 35 miles. The team members feel otherwise. A sample of 16 fans who travel to games was randomly selected and yielded a mean of M= 36 miles and s= 5 miles. Test the coach’s claim at the 5% (.05) level of significance. one-tailed or two-tailed test: State the hypotheses: df= tα or t value for the critical region = sM = t (test statistic)= Decision:arrow_forwardAccording to a large oil company, the average cost per barrel of oil last year was $47. You believe that due to the current oil crisis in Russia and Iran that the cost of a barrel of oil has decreased. You collect a simple random sample of 60 barrels of oil and find an average price of $42 and a standard deviation of $12. Use this information to answer the following questions and conduct the hypothesis test with a level of significance of a = .01. You may use Statcrunch or a calculator. Write all non-calculation answers in complete sentences. a. Which test would you use and why? b. Write the null and alternative hypothesis in complete sentences. (Make sure you mark which is the null and which is the alternative.) c. Write the null and alternative hypothesis as symbols. d. State the requirements that have been met to run the test. e. What is the test statistic and the p-value? (Make sure you use the right notation.) f. Should you reject or fail to reject the null hypothesis? g. State…arrow_forwardWe want to conduct a hypothesis test of the claim that for middle-aged adults the population's mean of their cholesterol levels is more than 199.3 mgdL. We choose a random sample of such levels. The sample has a mean of 197.3 mgdL and a standard deviation of 19.5 mgdL. For each of the following sampling scenarios, choose an appropriate test statistic for our hypothesis test on the population mean. Then calculate that statistic. Round your answers to two decimal places. (a) The sample has size 105, and it is from a non-normally distributed population with a known standard deviation of 19.2. z = t = It is unclear which test statistic to use. (b) The sample has size 12, and it is from a normally distributed population with an unknown standard deviation. z = t = It is unclear which test statistic to use.arrow_forward
arrow_back_ios
arrow_forward_ios
Recommended textbooks for you
- MATLAB: An Introduction with ApplicationsStatisticsISBN:9781119256830Author:Amos GilatPublisher:John Wiley & Sons Inc
 Probability and Statistics for Engineering and th...StatisticsISBN:9781305251809Author:Jay L. DevorePublisher:Cengage Learning
 Statistics for The Behavioral Sciences (MindTap C...StatisticsISBN:9781305504912Author:Frederick J Gravetter, Larry B. WallnauPublisher:Cengage Learning
  Elementary Statistics: Picturing the World (7th E...StatisticsISBN:9780134683416Author:Ron Larson, Betsy FarberPublisher:PEARSON
 The Basic Practice of StatisticsStatisticsISBN:9781319042578Author:David S. Moore, William I. Notz, Michael A. FlignerPublisher:W. H. Freeman
 Introduction to the Practice of StatisticsStatisticsISBN:9781319013387Author:David S. Moore, George P. McCabe, Bruce A. CraigPublisher:W. H. Freeman
MATLAB: An Introduction with Applications
Statistics
ISBN:9781119256830
Author:Amos Gilat
Publisher:John Wiley & Sons Inc
Probability and Statistics for Engineering and th...
Statistics
ISBN:9781305251809
Author:Jay L. Devore
Publisher:Cengage Learning
Statistics for The Behavioral Sciences (MindTap C...
Statistics
ISBN:9781305504912
Author:Frederick J Gravetter, Larry B. Wallnau
Publisher:Cengage Learning
Elementary Statistics: Picturing the World (7th E...
Statistics
ISBN:9780134683416
Author:Ron Larson, Betsy Farber
Publisher:PEARSON
The Basic Practice of Statistics
Statistics
ISBN:9781319042578
Author:David S. Moore, William I. Notz, Michael A. Fligner
Publisher:W. H. Freeman
Introduction to the Practice of Statistics
Statistics
ISBN:9781319013387
Author:David S. Moore, George P. McCabe, Bruce A. Craig
Publisher:W. H. Freeman