
MATLAB: An Introduction with Applications
6th Edition
ISBN: 9781119256830
Author: Amos Gilat
Publisher: John Wiley & Sons Inc
expand_more
expand_more
format_list_bulleted
Related questions
Question
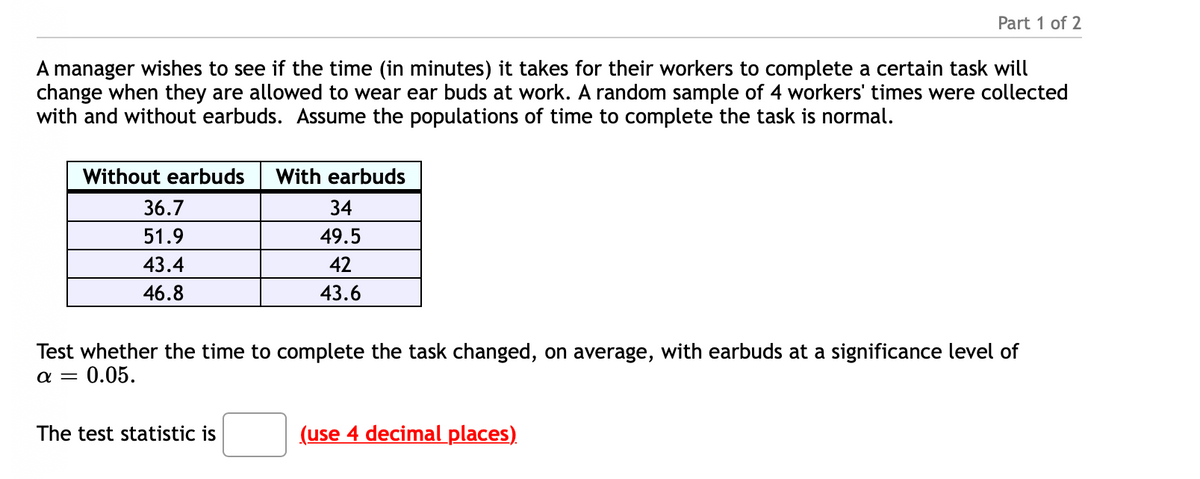

Transcribed Image Text:Part 1 of 2
A manager wishes to see if the time (in minutes) it takes for their workers to complete a certain task will
change when they are allowed to wear ear buds at work. A random sample of 4 workers' times were collected
with and without earbuds. Assume the populations of time to complete the task is normal.
Without earbuds
With earbuds
36.7
34
51.9
49.5
43.4
42
46.8
43.6
Test whether the time to complete the task changed, on average, with earbuds at a significance level of
0.05.
a =
The test statistic is
(use 4 decimal places)
Expert Solution
This question has been solved!
Explore an expertly crafted, step-by-step solution for a thorough understanding of key concepts.

This is a popular solution

Trending nowThis is a popular solution!

Step by stepSolved in 2 steps with 1 images

Knowledge Booster

Similar questions
- 6.1 Sexual harassment of college students. A survey of 2036 undergraduate college students aged 18 to 24 reports that 62% of college students say they have encountered some type of sexual harassment while at college.1 Describe the sample and the population for this setting 6.4 How often do they play? In the Pew survey described in Example 6.1, those who played video games were asked how often they played. In this subpopulation, 223 adults said that they played every day or almost every day 6.10 How often do they play? Refer to Exercise 6.4 (page 318). (a) Find SE^p, the standard error of ^p. (b) Give the 95% confidence interval for p in the form of estimate plus or minus the margin of error. (c) Give the confidence interval as an interval of percents.arrow_forwardA reviewer checks to see if a bag of candy weighs less than advertised (e.g., 100 grams). What is the appropriate test statistic for each scenario a. One sample Z-test b. One sample t-test c. two related samples t-test d. two indepdent samples t-testarrow_forwardQ8. Please help.arrow_forward
- A consumer magazine wants to compare the lifetimes of ballpoint pens of three different brands (measured in days). The magazine takes a random sample of pens of each type in the following table. What is the correct test statistic? Brand 1 Brand 2 Brand 3 382 181 238 242 140 257 216 162 241 319 218 213 a. F (2, 9) = 5.54 b.r = -.34 c. t (11) = 12.16 d.p = .027arrow_forwardThe mean number of sick days an employee takes per year is believed to be about 10. Members of a personnel department do not believe this figure. They randomly survey 8 employees. The number of sick days they took for the past year are as follows: 10; 5; 13; 3; 11; 8; 6; 9. Let X = the number of sick days they took for the past year. Should the personnel team believe that the mean number is about 10? Conduct a hypothesis test at the 5% level.Note: If you are using a Student's t-distribution for the problem, you may assume that the underlying population is normally distributed. (In general, you must first prove that assumption, though.) What is the test statistic? (If using the z distribution round your answers to two decimal places, and if using the t distribution round your answers to three decimal places.) t = Construct a 95% confidence interval for the true mean. Sketch the graph of the situation. Label the point estimate and the lower and upper bounds of the confidence…arrow_forwardJulius has conducted a very small study of the amount of sleep his dorm mates get each night. He believes that those who are on one of the school’s sports teams will get more sleep (measured in hours per night) than those who are not. Julius surveyed 12 people. Of these, 6 played on a sports team and 6 did not. The descriptive statistics from his survey are given below. PLAYS SPORTS (Sample 1) DOES NOT PLAY SPORTS (Sample 2) 8 6 9 6 8 5 7 7 8 7 7 6 What is the critical value for this test? what is the t-obtain value for this t-test? Based on your t-obtained value, what should you conclude about the null hypothesis for this test?arrow_forward
- A hypertension trial is mounted, and 12 participants are randomly assigned to receive either a new medication or a placebo. Each participant takes the assigned medication, and the participants’ SBP is recorded after 6 months on the assigned medication. The data are shown in Table 7–9. Is there a difference in mean SBP between treatments? Run the appropriate test at a = 0.05. Placebo New Medication 134 114 143 117 148 121 142 124 150 122 160 128arrow_forwardThe mean number of sick days an employee takes per year is believed to be about 10.5. Members of a personnel department do not believe this figure. They randomly survey ten employees. The number of sick days they took for the past year are as follows: 12; 4; 15; 3; 11; 8; 6; 8; 2; 9. Let x = the number of sick days they took for the past year. Should the personnel team believe that the mean number is ten?arrow_forwardThe city of Hampton is surveying households to see if the number of cats per household has changed over the past decade. The last known average of cats per household was 1.08. What statistical procedure should you use to analyze these data? O one sample z test Oone sample t test O correlated groups t test O independent groups t testarrow_forward
arrow_back_ios
arrow_forward_ios
Recommended textbooks for you
- MATLAB: An Introduction with ApplicationsStatisticsISBN:9781119256830Author:Amos GilatPublisher:John Wiley & Sons Inc
 Probability and Statistics for Engineering and th...StatisticsISBN:9781305251809Author:Jay L. DevorePublisher:Cengage Learning
 Statistics for The Behavioral Sciences (MindTap C...StatisticsISBN:9781305504912Author:Frederick J Gravetter, Larry B. WallnauPublisher:Cengage Learning
  Elementary Statistics: Picturing the World (7th E...StatisticsISBN:9780134683416Author:Ron Larson, Betsy FarberPublisher:PEARSON
 The Basic Practice of StatisticsStatisticsISBN:9781319042578Author:David S. Moore, William I. Notz, Michael A. FlignerPublisher:W. H. Freeman
 Introduction to the Practice of StatisticsStatisticsISBN:9781319013387Author:David S. Moore, George P. McCabe, Bruce A. CraigPublisher:W. H. Freeman
MATLAB: An Introduction with Applications
Statistics
ISBN:9781119256830
Author:Amos Gilat
Publisher:John Wiley & Sons Inc
Probability and Statistics for Engineering and th...
Statistics
ISBN:9781305251809
Author:Jay L. Devore
Publisher:Cengage Learning
Statistics for The Behavioral Sciences (MindTap C...
Statistics
ISBN:9781305504912
Author:Frederick J Gravetter, Larry B. Wallnau
Publisher:Cengage Learning
Elementary Statistics: Picturing the World (7th E...
Statistics
ISBN:9780134683416
Author:Ron Larson, Betsy Farber
Publisher:PEARSON
The Basic Practice of Statistics
Statistics
ISBN:9781319042578
Author:David S. Moore, William I. Notz, Michael A. Fligner
Publisher:W. H. Freeman
Introduction to the Practice of Statistics
Statistics
ISBN:9781319013387
Author:David S. Moore, George P. McCabe, Bruce A. Craig
Publisher:W. H. Freeman