
Advanced Engineering Mathematics
10th Edition
ISBN: 9780470458365
Author: Erwin Kreyszig
Publisher: Wiley, John & Sons, Incorporated
expand_more
expand_more
format_list_bulleted
Related questions
Question
thumb_up100%
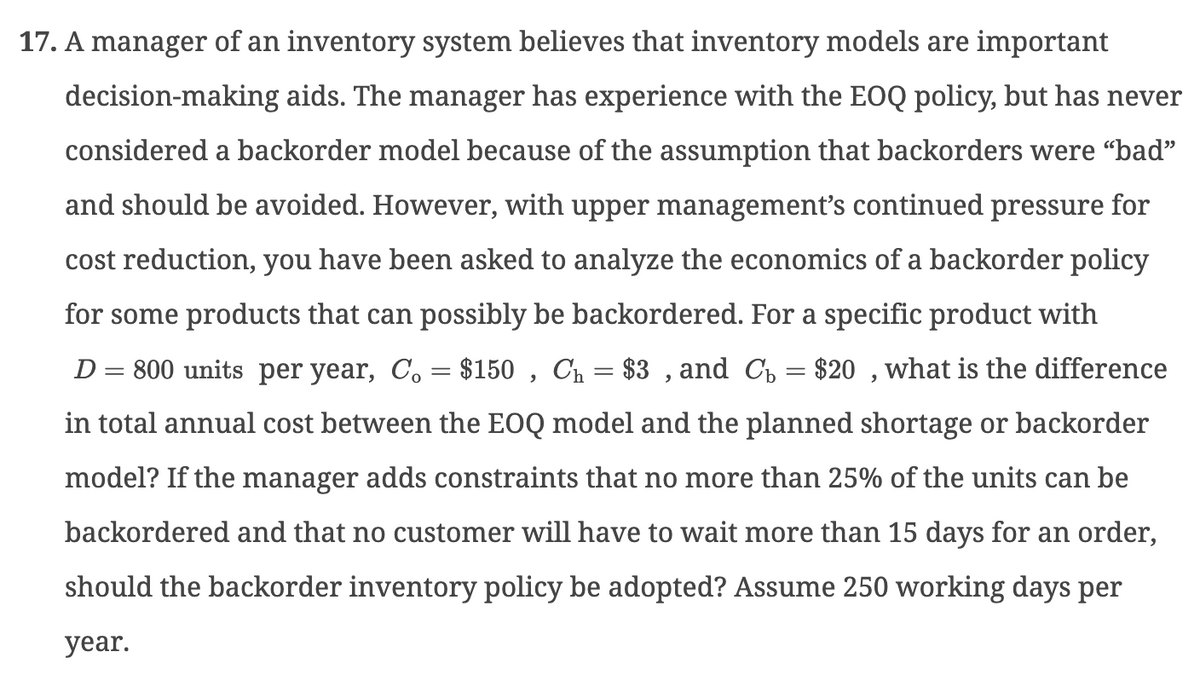

Transcribed Image Text:17. A manager of an inventory system believes that inventory models are important
decision-making aids. The manager has experience with the EOQ policy, but has never
considered a backorder model because of the assumption that backorders were "bad"
and should be avoided. However, with upper management's continued pressure for
cost reduction, you have been asked to analyze the economics of a backorder policy
for some products that can possibly be backordered. For a specific product with
D = 800 units per year, C. = $150, C₁ = $3, and C₁ = $20, what is the difference
in total annual cost between the EOQ model and the planned shortage or backorder
model? If the manager adds constraints that no more than 25% of the units can be
backordered and that no customer will have to wait more than 15 days for an order,
should the backorder inventory policy be adopted? Assume 250 working days per
year.
Expert Solution
This question has been solved!
Explore an expertly crafted, step-by-step solution for a thorough understanding of key concepts.

Step by stepSolved in 4 steps with 3 images

Knowledge Booster

Similar questions
- If Starbright Coffee Shop could get 1 more pound of coffee, which one should it be?What would be the effect on sales of getting 1 more pound of this coffee?• If the costs associated with increasing brewing capacity from 30 gallons to 40 gallonsper day come out to roughly $15 per day, would such a change be profitable?• If the shop spent $20 per day on advertising that would increase the relative demandfor Pomona to twice that of Coastal, should it be done?arrow_forwardSuppose you are the marketing manager of a firm, and you plan to introduce a new product to the market. You have to estimate the first year net profit, which depends on several variables • Sales volume (in units) • Price per unit • Unit cost . Fixed costs Your net profit is net profit = sales volume x (price per unit-unit cost) - fixed cost The fixed cost is $120, 000, but other factors have some uncertainty. Based on your market research, there are equal chance that the market will be slow, ok, or hot. • Slow market the sales volume follows Poisson distribution with mean 50,000 units product, and the average price per unit is $11.00 ● Ok market the sales volume follows Poisson distribution with mean 75,000 units product, the average price per unit is $10.00 Hot market: the sales volume follows Poisson distribution with mean 100,000 units product, but the competition is severe so you expect the average price per unit is just $8.00 No matter what the market type is, your average unit…arrow_forwardThe new business venture, Best-In-World, has been manufacturing technology devices for over 20 years and is considering adding a new technology device to its music line. They have an established reputation for building quality devices, but they are rather novice in the music industry. The Chief Innovation and Design Officer, Julie Naugle-Hall, is tasked with hiring a marketing firm to conduct a survey to determine the feasibility and demand for their new music device. The follow decision table illustrates the potential payoffs for a high demand, moderate demand and low demand for the new music device. The decision will be whether to start production on this new device in small scale, large scale or not at all. Alternatives Answer Small-scale production Large-scale production No production Probabilities Step 2 of 3: What is the Expected Value with Perfect Information? $ Decision Table High Demand 850,000 1,700,000 0 0.20 State of Nature Moderate Demand 300,000 700,000 0 0.50 Low Demand…arrow_forward
- 1. Suppose that you estimate a model of house prices to determine the impact of having beach frontage on the value of a house.14 You do some research, and you decide to use the size of the lot instead of the size of the house for a number of theoretical and data availability rea- sons. Your results (standard errors in parentheses) are: PRICE; = 40 + 35.0 LOT¡ – 2.0 AGE; + 10.0 BED; – 4.0 FIRE; (1.0) (5.0) (10.0) (4.0) (10) N = 30 R2 =.63 where: PRICE¡ =the price of the th house (in thousands of dollars) =the size of the lot of the th house (in thousands of square feet) = the age of the th house in years =the number of bedrooms in the th house =a qualitative/dummy variable for a fireplace (1 = yes for the th house) LOT; AGE; BED; FIRE; a. You expect the variables LOT and BED to have positive coefficients. Create and test the appropriate hypotheses to evaluate these expectations at the 5-percent level. b. You expect AGE to have a negative coefficient. Create and test the appropriate…arrow_forwardThe new business venture, Best-In-World, has been manufacturing technology devices for over 20 years and is considering adding a new technology device to its music line. They have an established reputation for building quality devices, but they are rather novice in the music industry. The Chief Innovation and Design Officer, Julie Naugle-Hall, is tasked with hiring a marketing firm to conduct a survey to determine the feasibility and demand for their new music device. The follow decision table illustrates the potential payoffs for a high demand, moderate demand and low demand for the new music device. The decision will be whether to start production on this new device in small scale, large scale or not at all. Alternatives Answer Small-scale production Large-scale production No production Probabilities Decision Table High Demand 850,000 1,700,000 0 0.20 State of Nature Moderate Demand 300,000 700,000 0 0.50 Low Demand -700,000 -1,000,000 0 0.30 Step 3 of 3: How much should Julie be…arrow_forwardYou are the VP, Advertising for “Yo’ Mama” brand, a fashion label that caters to the young, trendy crowd with an urban, hip-hop image. While your customer base has traditionally been largely African-American, you have recognized a tremendous influx of Hispanic consumers into your market. You are preparing for next week’s annual budget meetings and you have decided to recommend an Hispanic-focused advertising campaign if the average monthly per store sales to Hispanic customers are at least the same as the average monthly per store sales to African-American customers in a sample of typical stores (sales data given below). Using an alpha of .05 and the 5-step hypothesis testing process, what will you recommend? Hint: Think about how many data points you actually have.arrow_forward
- Table 1. The manager of Carpet City outlet store needs to be able to forecast accurately demand for Soft Shang carpet. Demand for the past 20 weeks appears in table 1 below. week Demand Forecast Error ABS. Dev Squared Error APE 1 20 2 28 3 22 4 18 5 22 6 22 7 22 8 26 9 23 10 23 11 23 12 27 13 25 14 22 15 23 16 14 17 14 18 15 19 11 20 16 21 22 23 24…arrow_forwardA local firm is planning its workforce and production levels over the next year. The firm makes a variety of microprocessors and uses sales dollars as its aggregate production unit. Based on orders received and sales forecasts provided by the marketing department, the estimate of dollar sales for the next year by month is as follows: Month Production Days Predicted Demand(in $10,000) Month Production Days Predicted Demand(in $10,000) January 20 595 July 20 410 February 19 225 August 21 130 March 22 565 September 19 405 April 18 205 October 23 315 May 21 230 November 21 355 June 22 120 December 18 350 Inventory holding costs are based on a 25% annual interest charge. It is anticipated that there will be 675 workers on the payroll at the end of the current year and inventories will amount to $120,000. The firm would like to have at least $100,000 of inventory at the end of December…arrow_forwardAn entrepreneur who owns and operates two businesses (A and B) would like to analyze their profitability. They would like your help in the analysis. They give you the annual net profit (in thousands of $) for each business from 2008-2020. Table 1: Annual Net Profits for Businesses A and B Business Year Profit Business Year Profit 2008 -50 2008 -10 2009 57 2009 30 2010 71 2010 27 2011 64 2011 22 2012 60 2012 21 2013 50 2013 20 A 2014 41 2014 24 2015 59 2015 24 2016 71 2016 32 2017 71 2017 36 2018 74 2018 37 019 81 20 40 2020 97 2020 49 a. Suppose you want to graph the distribution of profits. Explain why using only one stem- plot might not be optimal for the analysis. b. Describe the correct stemplot to use. Generate this stemplot. Explain your steps. What can you say about the distribution from this stemplot? c. When are stemplots useful? And why is that? d. Suppose that instead of having 26 observations you have 200 observations. What graph should you generate? e. What other type of…arrow_forward
- Overhead Door (OD) Corporation’s founder, C. G. Johnson, invented the upward-lifting garage door in 1921 and the electric garage door opener in 1926. Since then OD has been a leading supplier of commercial, industrial, and residential garage doors sold through a nationwide network of more than 450 authorized distributors. They have built a solid reputation as a premier door supplier, commanding 15 % share of the market. Suppose that customers assess door quality first in terms of the ease of operation, followed by its durability. The quality improvement team (QIT) might then assign an engineering team to determine the factors that contribute to these two main problems. Smooth operation of a garage door is a critical quality characteristic that affects both problems: If a door is too heavy, it’s difficult and unsafe to balance and operate; if it’s too light, it tends to buckle and break down frequently or may not close properly. Suppose the design engineers determine that a standard…arrow_forwardThe new business venture, Best-In-World, has been manufacturing technology devices for over 20 years and is considering adding a new technology device to its music line. They have an established reputation for building quality devices, but they are rather novice in the music industry. The Chief Innovation and Design Officer, Julie Naugle-Hall, is tasked with hiring a marketing firm to conduct a survey to determine the feasibility and demand for their new music device. The follow decision table illustrates the potential payoffs for a high demand, moderate demand and low demand for the new music device. The decision will be whether to start production on this new device in small scale, large scale or not at all, Alternatives Answer Small-scale production Large-scale production No production Probabilities Step 1 of 3: Calculate the EMV for each alternative. Decision Table High Demand 900,000 1,500,000 0 0.25 EMV (small-scale) = = S EMV (large-scale) = = $ EMV (no production) = S State of…arrow_forward
arrow_back_ios
arrow_forward_ios
Recommended textbooks for you
- Advanced Engineering MathematicsAdvanced MathISBN:9780470458365Author:Erwin KreyszigPublisher:Wiley, John & Sons, Incorporated
 Numerical Methods for EngineersAdvanced MathISBN:9780073397924Author:Steven C. Chapra Dr., Raymond P. CanalePublisher:McGraw-Hill Education
 Introductory Mathematics for Engineering Applicat...Advanced MathISBN:9781118141809Author:Nathan KlingbeilPublisher:WILEY
  Mathematics For Machine TechnologyAdvanced MathISBN:9781337798310Author:Peterson, John.Publisher:Cengage Learning,

Advanced Engineering Mathematics
Advanced Math
ISBN:9780470458365
Author:Erwin Kreyszig
Publisher:Wiley, John & Sons, Incorporated
Numerical Methods for Engineers
Advanced Math
ISBN:9780073397924
Author:Steven C. Chapra Dr., Raymond P. Canale
Publisher:McGraw-Hill Education
Introductory Mathematics for Engineering Applicat...
Advanced Math
ISBN:9781118141809
Author:Nathan Klingbeil
Publisher:WILEY
Mathematics For Machine Technology
Advanced Math
ISBN:9781337798310
Author:Peterson, John.
Publisher:Cengage Learning,