
A First Course in Probability (10th Edition)
10th Edition
ISBN: 9780134753119
Author: Sheldon Ross
Publisher: PEARSON
expand_more
expand_more
format_list_bulleted
Related questions
Question
thumb_up100%
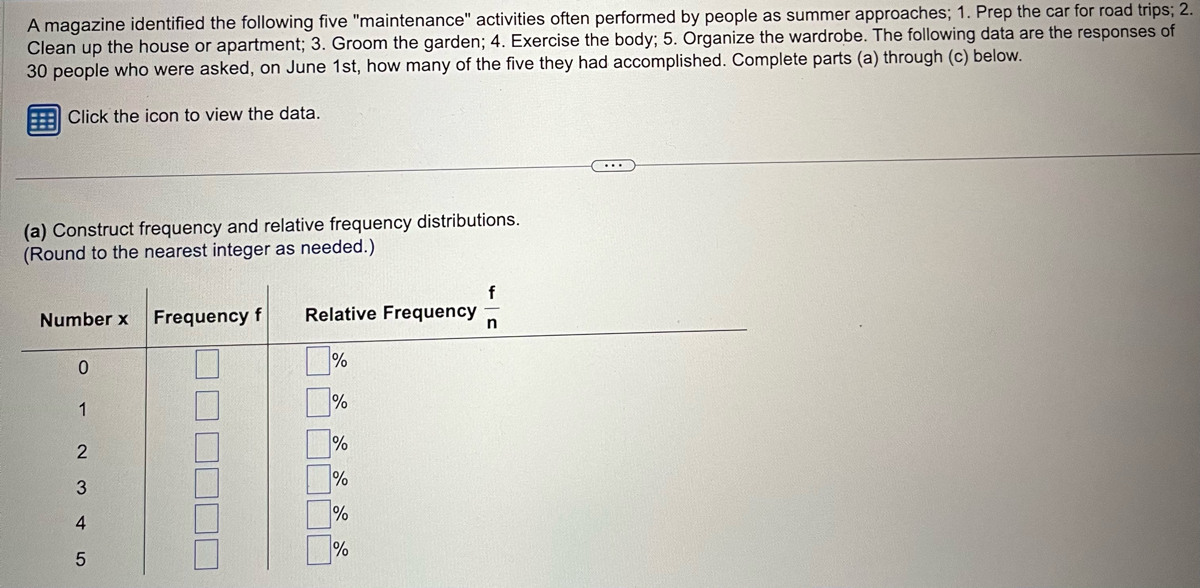

Transcribed Image Text:A magazine identified the following five "maintenance" activities often performed by people as summer approaches; 1. Prep the car for road trips; 2.
Clean up the house or apartment; 3. Groom the garden; 4. Exercise the body; 5. Organize the wardrobe. The following data are the responses of
30 people who were asked, on June 1st, how many of the five they had accomplished. Complete parts (a) through (c) below.
Click the icon to view the data.
(a) Construct frequency and relative frequency distributions.
(Round to the nearest integer as needed.)
Number x Frequency f
0
1
2345
Relative Frequency
%
%
%
%
%
%
f
n

Transcribed Image Text:Data Table
052
4
1
0
15
0 2
3
1
2
0
0 3
4 1
Full data set
0 3
4 1
2
0
2
1
0
1
0
3
Expert Solution
This question has been solved!
Explore an expertly crafted, step-by-step solution for a thorough understanding of key concepts.

This is a popular solution

Trending nowThis is a popular solution!

Step by stepSolved in 3 steps with 1 images

Knowledge Booster

Similar questions
- A congressperson wants to come up with a single value to describe the prices of homes in their district. However, their district consists of a few homes that are extremely expensive compared to the others. Which descriptive statistic should they use? a. Range b. Mode c. Median d. Meanarrow_forwardAccording to the CDC, only 20% of Americans get enough exercise each week. You conduct a survey of 200 people and find 45 who get enough exercise. a. What is the parameter? A. The proportion of people in the survey who get enough exercise. B. The proportion of all Americans who get enough exercise. C. All Americans. D. The people in the survey. E. All Americans who get enough exercise. b. What is the numerical value of the parameter? (If your answer is a proportion, enter it as a number between 0 and 1. If the numerical value is not known, enter “NA” without the quotes.) c. What is the statistic? A. All Americans who get enough exercise. B. The people in the survey. C. The proportion of people in the survey who get enough exercise. D. The proportion of all Americans who get enough exercise. E. The people in the survey who get enough exercise.d. What is the numerical value of the statistic? (If your answer is a proportion, enter it as a number between 0 and 1. If the numerical value is…arrow_forwardThe annual incomes of five people are presented in the table below. When measuring the income distribution in quintiles, which income amount would be considered part of the fourth quintile? Please type the income exactly as presented in the table. Weston $10, 000 Violet $30, 000 Luke $15, 000 Alex $50, 000 Madison $25, 000 Provide your answer below:arrow_forward
- Classify each of the following as nominal, ordinal, interval, or ratio data and explain. a. the time required to produce each car on an assembly line. b. the number of litres of water a family drinks in a month. c. the ranking of four student projects in your class after they have been designated as excellent, good, satisfactory, and poor. d. the telephone area code of clients in India. e. Explain the four groups of data in detail.arrow_forwardDetermine which of the following variables are quantitative. A: Rating of the effectiveness of a new cold remedy (Not effective, Somewhat effective, Very effective) B: Amount of time spent assembling a five-shelf bookcase. C. Number of children in a family. Group of answer choices A and B and C B and C A and C A and Barrow_forwardA magazine identified the following five "maintenance" activities often performed by people as summer approaches; 1. Prep the car for road trips; 2. Clean up the house or apartment; 3. Groom the garden; 4. Exercise the body; 5. Organize the wardrobe. The following data are the responses of 30 people who were asked, on June 1st, how many of the five they had accomplished. Complete parts (a) through (c) below. Click the icon to view the data. 0 O A. Frequency 1 2 3 4 5 14 6 13% 10% 7% 3% (b) Construct a histogram. Choose the correct graph below. 15- 12- 4 3 2 1 0 1 2 3 4 5 Activities Performed 47% 20% Q O B. Frequency 오오오오오오 0 1 2 3 4 5 Activities Performed Q Q Frequency SNSSO 15- Data Table 0 1 2 3 4 5 Activities Performed 1 4 3 0 0 1 Q 0 0 2 Print 0 1 4 1 3 0 Frequency 2 0 0 Full data set 0 0 2 1 20 300 5 0 1 Done 0 1 2 3 4 5 Activities Performed Qarrow_forward
arrow_back_ios
arrow_forward_ios
Recommended textbooks for you
- A First Course in Probability (10th Edition)ProbabilityISBN:9780134753119Author:Sheldon RossPublisher:PEARSON

A First Course in Probability (10th Edition)
Probability
ISBN:9780134753119
Author:Sheldon Ross
Publisher:PEARSON