
MATLAB: An Introduction with Applications
6th Edition
ISBN: 9781119256830
Author: Amos Gilat
Publisher: John Wiley & Sons Inc
expand_more
expand_more
format_list_bulleted
Related questions
Question
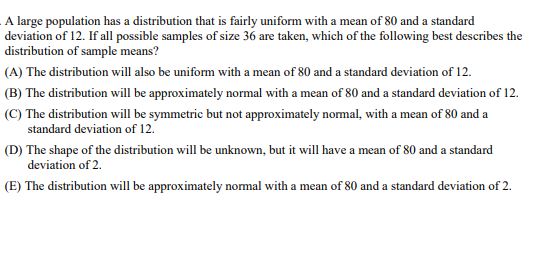

Transcribed Image Text:A large population has a distribution that is fairly uniform with a mean of 80 and a standard
deviation of 12. If all possible samples of size 36 are taken, which of the following best describes the
distribution of sample means?
(A) The distribution will also be uniform with a mean of 80 and a standard deviation of 12.
(B) The distribution will be approximately normal with a mean of 80 and a standard deviation of 12.
(C) The distribution will be symmetric but not approximately normal, with a mean of 80 and a
standard deviation of 12.
(D) The shape of the distribution will be unknown, but it will have a mean of 80 and a standard
deviation of 2.
(E) The distribution will be approximately normal with a mean of 80 and a standard deviation of 2.
SAVE
AI-Generated Solution
info
AI-generated content may present inaccurate or offensive content that does not represent bartleby’s views.
Unlock instant AI solutions
Tap the button
to generate a solution
to generate a solution
Click the button to generate
a solution
a solution
Knowledge Booster

Similar questions
- The scores on a standardized test are normally distributed with a mean of 120 and standard deviation of 5. What test score is 1.1 standard deviations above the mean?arrow_forwardSuppose that 44% of all adults think that airline travel is safer than driving. An opinion poll plans to ask a simple random sample (SRS) of 1021 adults about airplane safety. The proportion of the sample who think that airline travel is safer than driving will vary if we take many samples from the same population. The sampling distribution of the sample proportion is approximately Normal with mean of 0.44 and standard deviations about 0.016. Sketch this Normal curve and use it to answer the following questions. 06 ccccccccccccit What is the probability p of getting a sample the misses the truth (44%) by 3.2% or more? Report your answer as a percent. p= W O i 9 hp -3 43°F Clear 6:38 PM 11/26/2022 % 1arrow_forwardThe scores on the Accuplacer test and High School GPAs are normally distributed.The Accuplacer test had a mean of 40 and a standard deviation of 8.High School GPAs had a mean of 3 and a standard deviation of 0.1.What high school GPA do you need to equal a score of 48 on the Accuplacer test?Give answer to two decimal places.arrow_forward
- Two chemical companies can supply a raw material. The concentration of a particular element in this material is important. The mean concentration for both suppliers is the same, but you suspect that the variability in concentration may differ for the two companies. The standard deviation of concentration in a random sample of n₁ = 10 batches produced by company 1 is s₁ = 4.7 grams per liter, and for company 2, a random sample of n₂ = 16 batches yield s₂ = 5.8 grams per liter. Is there sufficient evidence to conclude that the two populations variances differ? Use a = 0.05. a. Because 0.321 < 0.657 <3.77, fail to reject the null hypothesis b. Because 0.265 < 0.657 <3.12, fail to reject the null hypothesis c. Because 0.386 < 0.657 <3.01, fail to reject the null hypothesis d. None among the choicesarrow_forwardSuppose that Melanie is a researcher who wishes to estimate the mean birthweight of full-term babies in her hospital. What is the minimum number of babies should she sample if she wishes to be at least 90% confident that the mean birthweight of the sample is within 225 grams of the the mean birthweight of all babies? Assume that the distribution of birthweights at her hospital is normal with a standard deviation of 600 g.arrow_forwardhe average amount of time boys and girls spend playing sports each week is believed to be the same. A sample of equal size n is taken from boys and girls , the mean of the boys is 29 hours with standard deviation 4 hours and the mean of the girls is 27 hours with standard deviation 3 hours Both populations have a normal distribution. The calculated value is 1.2 n =arrow_forward
arrow_back_ios
arrow_forward_ios
Recommended textbooks for you
- MATLAB: An Introduction with ApplicationsStatisticsISBN:9781119256830Author:Amos GilatPublisher:John Wiley & Sons Inc
 Probability and Statistics for Engineering and th...StatisticsISBN:9781305251809Author:Jay L. DevorePublisher:Cengage Learning
 Statistics for The Behavioral Sciences (MindTap C...StatisticsISBN:9781305504912Author:Frederick J Gravetter, Larry B. WallnauPublisher:Cengage Learning
  Elementary Statistics: Picturing the World (7th E...StatisticsISBN:9780134683416Author:Ron Larson, Betsy FarberPublisher:PEARSON
 The Basic Practice of StatisticsStatisticsISBN:9781319042578Author:David S. Moore, William I. Notz, Michael A. FlignerPublisher:W. H. Freeman
 Introduction to the Practice of StatisticsStatisticsISBN:9781319013387Author:David S. Moore, George P. McCabe, Bruce A. CraigPublisher:W. H. Freeman
MATLAB: An Introduction with Applications
Statistics
ISBN:9781119256830
Author:Amos Gilat
Publisher:John Wiley & Sons Inc
Probability and Statistics for Engineering and th...
Statistics
ISBN:9781305251809
Author:Jay L. Devore
Publisher:Cengage Learning
Statistics for The Behavioral Sciences (MindTap C...
Statistics
ISBN:9781305504912
Author:Frederick J Gravetter, Larry B. Wallnau
Publisher:Cengage Learning
Elementary Statistics: Picturing the World (7th E...
Statistics
ISBN:9780134683416
Author:Ron Larson, Betsy Farber
Publisher:PEARSON
The Basic Practice of Statistics
Statistics
ISBN:9781319042578
Author:David S. Moore, William I. Notz, Michael A. Fligner
Publisher:W. H. Freeman
Introduction to the Practice of Statistics
Statistics
ISBN:9781319013387
Author:David S. Moore, George P. McCabe, Bruce A. Craig
Publisher:W. H. Freeman