MATLAB: An Introduction with Applications
6th Edition
ISBN: 9781119256830
Author: Amos Gilat
Publisher: John Wiley & Sons Inc
expand_more
expand_more
format_list_bulleted
Question
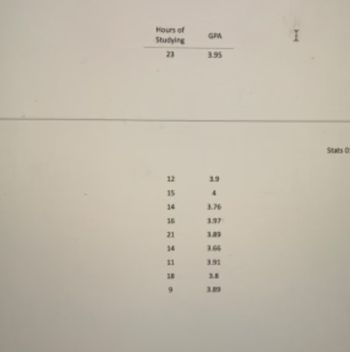
A hich school principal is interested in learning if hours studied and GPa earned related of a group of honor student. Conduct a

Transcribed Image Text:Hours of
Studying
23
12
15
14
16
21
14
11
9
GPA
3.95
3.9
4
3.76
3.97
3.89
3.66
GIFE
Stats 0
Expert Solution
This question has been solved!
Explore an expertly crafted, step-by-step solution for a thorough understanding of key concepts.
This is a popular solution
Trending nowThis is a popular solution!
Step by stepSolved in 3 steps with 10 images

Knowledge Booster
Similar questions
- A researcher found the correlation between math ability and math anxiety is -0.6. Which of the following is NOT correct? The people who have lower math ability tend to have higher math anxiety. The people who have higher math ability tend to have lower math anxiety. Student A has high math anxiety is because she/he has a low math abilityarrow_forwardA newspaper collected information on schools in its circulation area in order to compare their quality. Two Which is a true statement regarding Springside? measures the newspaper collected for each school, O Springside does not affect the correlation. mean class size and mean score on a statewide O Springside weakens the correlation shown in the scatterplot. reading exam, are shown in the scatterplot. One school in the report, Springside Elementary, is labeled in the graph. O Springside strengthens the correlation shown in the scatterplot. O Removing Springside would increase the value of the correlation coefficient. Comparing Schools 90 Springside 70 60 50 40 Save and Exit Next Submit Mark this and return ContentViewers/AssessmentViewer/Activity# ch hp Mean State Test Scorearrow_forwardHello! Please look at the image attached. There are 6 correlation scatter graphs which each represents a continent. Please analyse the graphs, as what they indicate and what they show as in the relationship between obesity% and life expectancy. Thank youarrow_forward
- Describe the correlation between (7) Self-talk and (1) Self-Reward. Describe the correlation in statistical terms and then provide an explanationarrow_forwardTrue or false .If there is no linear correlation between enrollment and the number of burglaries , then those two variables are not related in anyway. Explain why ?arrow_forwardIn running a Pearson correlation, you notice that there are a few outliers. Please describe the next course of action, if any, for the dataset and explain your reasoning.arrow_forward
- Major League Baseball (MLB) consists of 30 The earned run average, ERA, is a statistic used to measure a pitcher's (the person who throws the ball to the person trying to hit the ball) effectiveness. The lower the ERA, the more effective the pitcher is. Statisticians are trying to show there is a correlation between the team’s ERA and the number of wins. The data on the spreadsheet is from all the teams in the 2021 regular season. Find the equation for the regression line for this data. Find the correlation coefficient and R2. State the Null and Alternate Hypothesis. State Decision Rule and Critical Value at the 5% significance level (think about whether this should be a one or two tailed test and which test statistic needs to be calculated). Compute the test statistic and p-value. What is your decision concerning Null? What does that mean? If the ERA were 4.5, what is the predicted number of wins (ŷ) using the regression line? ERA to wins in 2021 (n = 30)…arrow_forwardFind a best fit line for ice cream consumption and murders. This is a classic example of "spurious" correlation. Ice Cream 2,1,2,3,2,4,5,3,2,1,2,1 Murders 8,21,16,18,22,25,22,30,20,10,14,9arrow_forwardAn LCBO employee compares the relationship between the price of 6 different vintage bottles of wine, and the number of those bottles that have been purchased in the last 3 months to see if there is a correlation between the number of bottles purchased and the price of the bottle. Number of Bottles of Wine Purchased in the Price of Wine Bottle ($) Last 3 Months 44 18 93 65 82 56 25 60 15 30 20 40arrow_forward
arrow_back_ios
arrow_forward_ios
Recommended textbooks for you
 MATLAB: An Introduction with ApplicationsStatisticsISBN:9781119256830Author:Amos GilatPublisher:John Wiley & Sons Inc
 Probability and Statistics for Engineering and th...StatisticsISBN:9781305251809Author:Jay L. DevorePublisher:Cengage Learning
 Statistics for The Behavioral Sciences (MindTap C...StatisticsISBN:9781305504912Author:Frederick J Gravetter, Larry B. WallnauPublisher:Cengage Learning
 Elementary Statistics: Picturing the World (7th E...StatisticsISBN:9780134683416Author:Ron Larson, Betsy FarberPublisher:PEARSON
 The Basic Practice of StatisticsStatisticsISBN:9781319042578Author:David S. Moore, William I. Notz, Michael A. FlignerPublisher:W. H. Freeman
 Introduction to the Practice of StatisticsStatisticsISBN:9781319013387Author:David S. Moore, George P. McCabe, Bruce A. CraigPublisher:W. H. Freeman

MATLAB: An Introduction with Applications
Statistics
ISBN:9781119256830
Author:Amos Gilat
Publisher:John Wiley & Sons Inc

Probability and Statistics for Engineering and th...
Statistics
ISBN:9781305251809
Author:Jay L. Devore
Publisher:Cengage Learning

Statistics for The Behavioral Sciences (MindTap C...
Statistics
ISBN:9781305504912
Author:Frederick J Gravetter, Larry B. Wallnau
Publisher:Cengage Learning

Elementary Statistics: Picturing the World (7th E...
Statistics
ISBN:9780134683416
Author:Ron Larson, Betsy Farber
Publisher:PEARSON

The Basic Practice of Statistics
Statistics
ISBN:9781319042578
Author:David S. Moore, William I. Notz, Michael A. Fligner
Publisher:W. H. Freeman

Introduction to the Practice of Statistics
Statistics
ISBN:9781319013387
Author:David S. Moore, George P. McCabe, Bruce A. Craig
Publisher:W. H. Freeman