
MATLAB: An Introduction with Applications
6th Edition
ISBN: 9781119256830
Author: Amos Gilat
Publisher: John Wiley & Sons Inc
expand_more
expand_more
format_list_bulleted
Related questions
Topic Video
Question
thumb_up100%
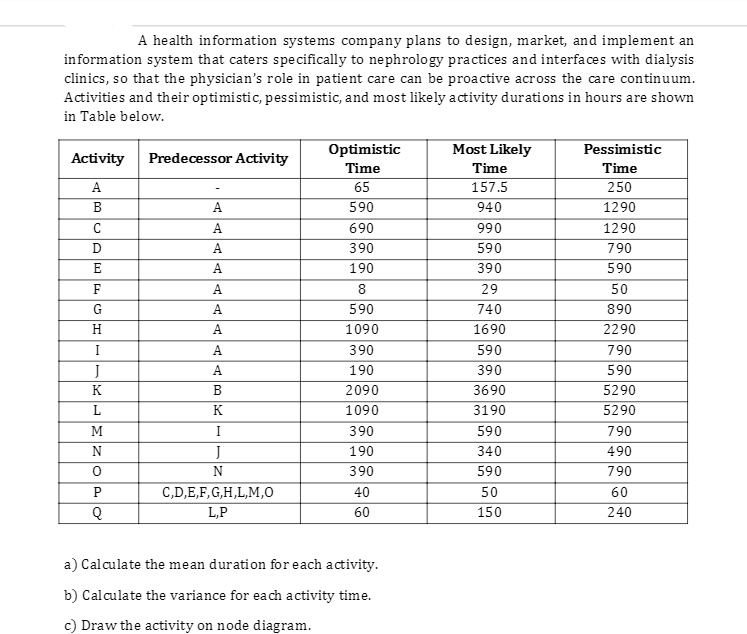

Transcribed Image Text:A health information systems company plans to design, market, and implement an
information system that caters specifically to nephrology practices and interfaces with dialysis
clinics, so that the physician's role in patient care can be proactive across the care continuum.
Activities and their optimistic, pessimistic, and most likely activity durations in hours are shown
in Table below.
Optimistic
Most Likely
Pessimistic
Activity
Predecessor Activity
Time
Time
Time
A.
65
157.5
250
B
А
590
940
1290
A
690
990
1290
D
A
390
590
790
E
А
190
390
590
F
А
8
29
50
G
A.
590
740
890
H
А
1090
1690
2290
I
A
390
590
790
J
A
190
390
590
K
B
2090
3690
5290
L
K
1090
3190
5290
M
I
390
590
790
N
J
190
340
490
N
390
590
790
C,D,E,F,G,H,L,M,0
40
50
60
L,P
60
150
240
a) Calculate the mean duration for each activity.
b) Calculate the variance for each activity time.
c) Draw the activity on node diagram.
Expert Solution
This question has been solved!
Explore an expertly crafted, step-by-step solution for a thorough understanding of key concepts.

This is a popular solution

Trending nowThis is a popular solution!

Step by stepSolved in 2 steps with 3 images

Knowledge Booster


Learn more about
Need a deep-dive on the concept behind this application? Look no further. Learn more about this topic, statistics and related others by exploring similar questions and additional content below.Similar questions
- Government funding: The following table presents the budget (in millions of dollars) for selected organizations that received U.S. government funding for arts and culture in both 2004 and 2006, Use a TI-84 calculator to answer the following. Organization 2004 2006 National Endowment for Arts 121 124 National Gallery of Art 88 95 Kennedy Center for the Performing Arts 18 Commission of Fine Arts Advisory Council on Historic Preservation Source: National Endowment for the Arts. Send data te Excel Part: 0/3 Part 1 of 3 Compute the least-squares regression line for predicting the 2006 budget from the 2004 budget. Round the slope and y- intercept to at least four decimal places. Regression line equation: y =arrow_forwardOrganizations are interested in identifying variables that will predict the performance of job applicants. Two known predictors of job performance are personality (i.e., conscientiousness) and years of formal education. Researchers at the University of Arkansas believe that number of previous jobs held by job applicants may also predict performance. However, in contrast to conscientiousness and years of formal education, the researchers anticipate that number of previous jobs held will have an inverse relationship with job performance. To test their ideas, the researchers asked 125 car salespeople from Fletcher Honda to fill out a questionnaire that measured (a) their level of conscientiousness (CONSC) on a 7 point scale (1 = strongly disagree and 7 = strongly agree) where higher scores reflect being more conscientious, (b) years of formal education (EDUC), (c) and number of previous jobs held (JOBS). To measure job performance, the researchers used company records to record the number…arrow_forwardChapter 3, Section 1, Exercise 001 State whether the quantity described is a parameter or a statistic and give the correct notation.Average household income for all houses in the US, using data from the US Census.arrow_forward
- Help please. I am extremely confused and do not understand this! Can I get help with all parts please?arrow_forwardWhat is business analytics? Briefly describe the domain of the major fields of business analytics databases and data warehousing, descriptive, predictive, and prescriptive analytics.arrow_forwardA researcher thinks some social media sites are more prone to narcissistic behavior (excessive posting) than others. To examine the relationship between narcissism and social media, she recruits users of three different social media sites (Facebook, Twitter and Instagram), follows them for 24 hours and records the number of posts made by each user. The number of posts is given in the table below. Twitter Facebook Instagram 10 7 14 10 8. 10 10 10 11 9. www. 12 wwww. 11 13 12 8. 7 8. 11 8 10 12 11 11 a. Perform a complete hypothesis test to determine whether there are any significant differences among the three groups. Test at the .05 level of significance. SHOW ALL YOUR WORK b. Do you need to perform post hocs? Explain but do not compute the post hocs. C. Compute effect size. d. Summarize your findings in a source table. e. Write an interpretation of our results in APA-format (include means and SDs in your interpretation)arrow_forward
- The table below gives the percent of U.S. seniors (aged 65+ years) who used the internet in selected years. Year 2012 2014 2016 2018 2019 % of U.S. seniors using internet 54 57 64 66 73 Use a line of best-fit to predict the percent of U.S. seniors who will use the internet in the year 2022. A. 74 % B.76 % C.77 % D.79 % E.81 %arrow_forwardPart 3arrow_forwardThe data below lists states poverty rate, gun deaths per 100,000 people, high school graduation rate and the unemployment rate. STATE New Jersey Vermont Minnesota Hawaii Delaware Utah Virginia Nebraska Connecticut Maryland Idaho Alaska Massachusetts Washington Wisconsin Nevada Wyoming Florida North Dakota Pennsylvania lowa Colorado Illinois Missouri South Dakota Michigan New Hampshire Rhode Island Ohio Kansas POVERTY% 6.80% 7.60% 8.10% 8.60% 9.20% 9.20% 9.20% 9.50% 9.70% 9.70% 9.90% 10.00% 10.10% 10.20% 10.20% 10.60% 10.60% 11.10% 11.20% 11.20% 11.30% 11.40% 11.50% 11.60% 11.80% 12.00% 12.00% 12.10% 12.30% 12.50% GUN DEATHS 5.7 9.2 12 2.6 10.3 12.6 10.2 9 4.4 9.7 14.1 17.6 3.1 8.7 9.7 13.8 16.7 11.9 11.8 11.2 8 11.5 8.6 12 10 12 6.4 5.3 11 11.4 H.S. GRAD's 91.8 91 91.5 90.4 87.4 90.4 86.6 89.8 88.6 88.2 88.4 91.4 89 89.7 89.8 83.9 87.4 85.3 90.1 87.9 91.4 89.3 86.4 86.8 89.9 87.9 91.3 84.7 87.6 89.7 UNEMPLOYMENT 5.7 3.6 4 3.5 4.9 3.7 4.5 2.8 5.3 5.1 4.2 6.6 4.7 5.3 4.5 6.8 4 5.3 2.9…arrow_forward
- Hospital Beds. The number of hospital beds available in community hospitals is decreasing. Through advancement in care and technology, hospitals are getting more efficient. However, the aging and increasingly obese and diabetic population intensifies the need. The American Hospital Association Annual Survey, published by the American Hospital Association (AHA), gave the number of hospital beds available per 1000 people for each of the 50 states plus the District of Columbia for 2010. Following is a stem-and-leaf diagram of the data. The stems represent units and the leaves tenths (e.g., the first entry is 1.7). How many states (including the District of Columbia) had a. at least three but less than four hospital beds per 1000 people available? b. at least four and a half hospital beds per 1000 people available?arrow_forward3arrow_forwardA psychologist believed that as children get older, they engage in more “inactive activities” such as playing computer games, watching TV and surfing the internet. She collected data from 10 children. She recorded the age of each child and the amount of activity (in hours) the child engaged in per week. Age Activity 7 4.3 9 3.2 10 1 13 1.5 12 1.2 15 0.8 9 3 12 4 15 1.5 14 1.9 Using excel, obtain a scatterplot of the data. Discuss the relationship between age and activity based on the scatterplot. Using excel, obtain the simple linear regression linear regression line predicting activity from age. Interpret the intercept and slope of the regression line. By hand, predict the amount of activity for age = 14. By hand, calculate the residual for age = 14 Using excel output, test the null hypothesis that the slope coefficient is zero using the p-value approach. Write one sentence interpreting the meaning of this result. Make sure to report the test statistic…arrow_forward
arrow_back_ios
SEE MORE QUESTIONS
arrow_forward_ios
Recommended textbooks for you
- MATLAB: An Introduction with ApplicationsStatisticsISBN:9781119256830Author:Amos GilatPublisher:John Wiley & Sons Inc
 Probability and Statistics for Engineering and th...StatisticsISBN:9781305251809Author:Jay L. DevorePublisher:Cengage Learning
 Statistics for The Behavioral Sciences (MindTap C...StatisticsISBN:9781305504912Author:Frederick J Gravetter, Larry B. WallnauPublisher:Cengage Learning
  Elementary Statistics: Picturing the World (7th E...StatisticsISBN:9780134683416Author:Ron Larson, Betsy FarberPublisher:PEARSON
 The Basic Practice of StatisticsStatisticsISBN:9781319042578Author:David S. Moore, William I. Notz, Michael A. FlignerPublisher:W. H. Freeman
 Introduction to the Practice of StatisticsStatisticsISBN:9781319013387Author:David S. Moore, George P. McCabe, Bruce A. CraigPublisher:W. H. Freeman
MATLAB: An Introduction with Applications
Statistics
ISBN:9781119256830
Author:Amos Gilat
Publisher:John Wiley & Sons Inc
Probability and Statistics for Engineering and th...
Statistics
ISBN:9781305251809
Author:Jay L. Devore
Publisher:Cengage Learning
Statistics for The Behavioral Sciences (MindTap C...
Statistics
ISBN:9781305504912
Author:Frederick J Gravetter, Larry B. Wallnau
Publisher:Cengage Learning
Elementary Statistics: Picturing the World (7th E...
Statistics
ISBN:9780134683416
Author:Ron Larson, Betsy Farber
Publisher:PEARSON
The Basic Practice of Statistics
Statistics
ISBN:9781319042578
Author:David S. Moore, William I. Notz, Michael A. Fligner
Publisher:W. H. Freeman
Introduction to the Practice of Statistics
Statistics
ISBN:9781319013387
Author:David S. Moore, George P. McCabe, Bruce A. Craig
Publisher:W. H. Freeman