
MATLAB: An Introduction with Applications
6th Edition
ISBN: 9781119256830
Author: Amos Gilat
Publisher: John Wiley & Sons Inc
expand_more
expand_more
format_list_bulleted
Related questions
Question
The value of test statistic t
P-Value =
State the final conclusion that addresses the original claim.
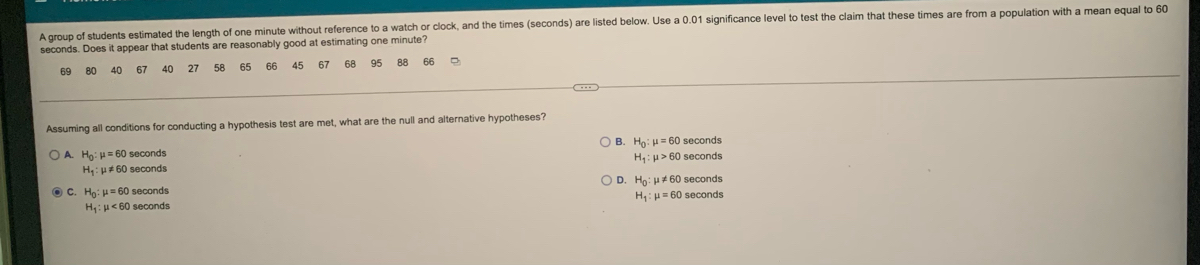

Transcribed Image Text:A group of students estimated the length of one minute without reference to a watch or clock, and the times (seconds) are listed below. Use a 0.01 significance level to test the claim that these times are from a population with a mean equal to 60
seconds. Does it appear that students are reasonably good at estimating one minute?
69
80
40
67
40
27
58
65
66
45
67
68
95
88
66
Assuming all conditions for conducting a hypothesis test are met, what are the null and alternative hypotheses?
O B. Ho: H = 60 seconds
O A. Ho: H= 60 seconds
H:p#60 seconds
H:> 60 seconds
O D. Ho: H 60 seconds
O C. Ho: H= 60 seconds
H:u< 60 seconds
H:H= 60 seconds
Expert Solution
This question has been solved!
Explore an expertly crafted, step-by-step solution for a thorough understanding of key concepts.

This is a popular solution

Trending nowThis is a popular solution!

Step by stepSolved in 3 steps with 3 images

Knowledge Booster

Similar questions
- What do you mean by Instrumental Variables Estimators in relation to quasi-experiment?arrow_forwardChose the most appropriate procedure to test the claim. This is all one question. Test the claim that a higher percent of African-American drivers are searched by the police than Caucasian drivers. [ Choose ] 2-Independent Population Mean Matched Pairs 2-Independent Population Proportion ANOVA 1-Population Mean against a hypothesized value Goodness-of-Fit Test 1-Population Proportion against a hypothesized value Test of Association Test the claim that marital status (Divorced, Married/Never Divorced) is related to religious affiliation (A, B, C, D). [ Choose ] 2-Independent Population Mean Matched Pairs 2-Independent Population Proportion ANOVA 1-Population Mean against a hypothesized value Goodness-of-Fit Test 1-Population Proportion against a hypothesized value…arrow_forwardTest of independence between X and Y. Does it reject or not the null hypothesis if chi-squared test statistic (0.009) is lower than the significance level (1%)? Would the variables be independent or not?arrow_forward
- Estimate the average weekly TV hours watched by students at this university with 99% confidence. What is the parameter of interest? Single Proportion, Single Mean, Difference in Proportions, Difference in Independent Means, Mean Difference (matched pairs), What type(s) of variables? One Quantitative One Categorical One Quantitative and One Categorical Two Categorical What conditions need to be checked? what is the formula for the correct Confidence Interval or Test Statistic? Define each variable in the formula and give its value.arrow_forwardThe results obtained from statistics analysis between the pulse rate at baseline and the pulse rate after smoking using t-test is 0.001, what should be the decision? reject the null hypothesis do not reject the null hypothesis restate the null hypothesis no decisionarrow_forwardThe display provided from technology available below results from using data for a smartphone carrier's data speeds at airports to test the claim that they are from a population having a mean less f than 4.00 Mbps. Conduct the hypothesis test using these results. Use a 0.05 significance level. Identify the null and alternative hypotheses, test statistic, P-value, and state the final conclusion that addresses the original claim. Click the icon to view the display from technology. @ 2 View an example Get more help. W S Assuming all conditions for conducting a hypothesis test are met, what are the null and alternative hypotheses? A. Ho: =4.00 Mbps H₁: 4.00 Mbps मे Identify the test statistic. (Round to two decimal places as needed.) X # 3 E 80 F3 D C $ 4 Q 20 F4 R F V % 5 FS T G A 6 B MacBook Air F6 Y H & 7 N 8 F7 U C J * 8 M OB. Ho: F10 . : - ; I option Clear all { [ ? 1 + = 11 Check answer F12 } 1 delete return shif Carrow_forward
arrow_back_ios
arrow_forward_ios
Recommended textbooks for you
- MATLAB: An Introduction with ApplicationsStatisticsISBN:9781119256830Author:Amos GilatPublisher:John Wiley & Sons Inc
 Probability and Statistics for Engineering and th...StatisticsISBN:9781305251809Author:Jay L. DevorePublisher:Cengage Learning
 Statistics for The Behavioral Sciences (MindTap C...StatisticsISBN:9781305504912Author:Frederick J Gravetter, Larry B. WallnauPublisher:Cengage Learning
  Elementary Statistics: Picturing the World (7th E...StatisticsISBN:9780134683416Author:Ron Larson, Betsy FarberPublisher:PEARSON
 The Basic Practice of StatisticsStatisticsISBN:9781319042578Author:David S. Moore, William I. Notz, Michael A. FlignerPublisher:W. H. Freeman
 Introduction to the Practice of StatisticsStatisticsISBN:9781319013387Author:David S. Moore, George P. McCabe, Bruce A. CraigPublisher:W. H. Freeman
MATLAB: An Introduction with Applications
Statistics
ISBN:9781119256830
Author:Amos Gilat
Publisher:John Wiley & Sons Inc
Probability and Statistics for Engineering and th...
Statistics
ISBN:9781305251809
Author:Jay L. Devore
Publisher:Cengage Learning
Statistics for The Behavioral Sciences (MindTap C...
Statistics
ISBN:9781305504912
Author:Frederick J Gravetter, Larry B. Wallnau
Publisher:Cengage Learning
Elementary Statistics: Picturing the World (7th E...
Statistics
ISBN:9780134683416
Author:Ron Larson, Betsy Farber
Publisher:PEARSON
The Basic Practice of Statistics
Statistics
ISBN:9781319042578
Author:David S. Moore, William I. Notz, Michael A. Fligner
Publisher:W. H. Freeman
Introduction to the Practice of Statistics
Statistics
ISBN:9781319013387
Author:David S. Moore, George P. McCabe, Bruce A. Craig
Publisher:W. H. Freeman