
MATLAB: An Introduction with Applications
6th Edition
ISBN: 9781119256830
Author: Amos Gilat
Publisher: John Wiley & Sons Inc
expand_more
expand_more
format_list_bulleted
Related questions
Concept explainers
Topic Video
Question
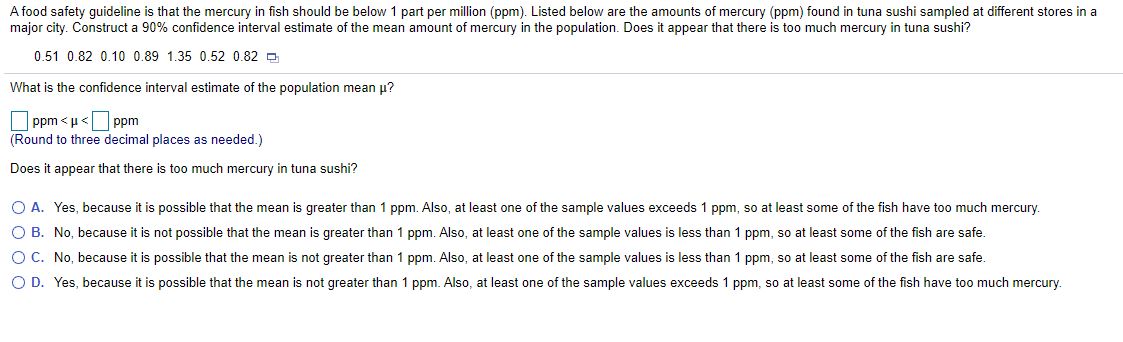

Transcribed Image Text:A food safety guideline is that the mercury in fish should be below 1 part per million (ppm). Listed below are the amounts of mercury (ppm) found in tuna sushi sampled at different stores in a
major city. Construct a 90% confidence interval estimate of the mean amount of mercury in the population. Does it appear that there is too much mercury in tuna sushi?
0.51 0.82 0.10 0.89 1.35 0.52 0.82 D
What is the confidence interval estimate of the population mean p?
ppm < μ
(Round to three decimal places as needed.)
ppm
Does it appear that there is too much mercury in tuna sushi?
O A. Yes, because it is possible that the mean is greater than 1 ppm. Also, at least one of the sample values exceeds 1 ppm, so at least some of the fish have too much mercury.
O B. No, because it is not possible that the mean is greater than 1 ppm. Also, at least one of the sample values is less than 1 ppm, so at least some of the fish are safe.
O C. No, because it is possible that the mean is not greater than 1 ppm. Also, at least one of the sample values is less than 1 ppm, so at least some of the fish are safe.
O D. Yes, because it is possible that the mean is not greater than 1 ppm. Also, at least one of the sample values exceeds 1 ppm, so at least some of the fish have too much mercury.
Expert Solution
This question has been solved!
Explore an expertly crafted, step-by-step solution for a thorough understanding of key concepts.

This is a popular solution

Trending nowThis is a popular solution!

Step by stepSolved in 2 steps with 2 images

Knowledge Booster


Learn more about
Need a deep-dive on the concept behind this application? Look no further. Learn more about this topic, statistics and related others by exploring similar questions and additional content below.Similar questions
- In a randoms sample of six people, the mean driving distance to work was 19.7 miles and the standard deviation was 6.1 miles. Assume the population is normally distributed and use the t-distribution to find the margin of error and construct a 90% confidence interval for the population mean u. Interpret the results.arrow_forwardDetermine the sample size needed to estimate a population with a mean of 10 units given that the population standard deviation is 50; use a confidence level of 90%.arrow_forwardThe standard deviation, S, for the annual medical cost of 24 households was found to equal $1689 find a 95% confidence interval for the standard deviation of the annual medical cost for all households. Assume medical costs are normally distributed.arrow_forward
- The average gold content from an ore sample in 36 different locations is found to be 2.6 grams per ton. a. Find the 95% and 99% confidence intervals for the mean gold content in that area. Assume that the population variance is 0.09.arrow_forwardSuppose the population standard deviation is = 5, an SRS of n = 100 is obtained, and the confidence level is chosen to be 99.5%. The margin of error for estimating a mean is given by: a. 1.576. b. 1.165. c. 1.404. d. 1.223.arrow_forwardThe manager of a fleet of automobiles is testing two brands of radial tires and assigns one tire of each brand at random to the two rear wheels of eight cars and runs the cars until the tires wear out. The data (in kilometers) follow. Find a 99% confidence interval on the difference in the mean life. Car Brand 1 Brand 2 1 36,925 34,318 2 45,300 42,280 3 36,256 35.548 4 32,100 31,950 5 37,210 38,015 6 48,360 47,800 7 38.200 37,810 8 33,500 33,215 Round your answer to 2 decimal places. Do not use commas.arrow_forward
- One method for measuring air pollution is to measure the concentration of carbon monoxide, or CO, in the air. Suppose Nina, an environmental scientist, wishes to estimate the CO concentration in Zagreb, Croatia. She randomly selects 45 locations throughout the city measures the CO concentration at each location. Based on her 45 samples, she computes the margin of error for a 95% t-confidence interval for the mean concentration of CO in Zagreb, in µg/m³, to be 4.28. What would happen to the margin of error if Nina decreases the confidence level to 90%? Nina increases the confidence level to 99%? Nina decreases the sample size to 33 locations? Nina increases the sample size to 65 locations? Answer Bank Increase Stay the same Decreasearrow_forwardTwelve samples of coal from a Northern Appalachian source had an average mercury content of 0.253 ppm with a standard deviation of 0.029 ppm. Suppose the density of mercury content of coal from this source is approximately normally distributed. a. Find the LOWER bound of a 95% confidence interval for the mean mercury content of coal from this source. b. Find the UPPER bound of a 95% confidence for the mean mercury content of coal from this source.arrow_forwardCalcium is essential to tree growth. In 1990, the concentration of calcium in precipitation in a certain area was 0.11milligrams per liter (mg/L).A random sample of 10 precipitation dates in 2018 results in the following data table. Complete parts (a) through (c) below. (B) With 98% confidence, the mean concentration of calcium in precipitation in this area in 2018 is betweenarrow_forward
arrow_back_ios
arrow_forward_ios
Recommended textbooks for you
- MATLAB: An Introduction with ApplicationsStatisticsISBN:9781119256830Author:Amos GilatPublisher:John Wiley & Sons Inc
 Probability and Statistics for Engineering and th...StatisticsISBN:9781305251809Author:Jay L. DevorePublisher:Cengage Learning
 Statistics for The Behavioral Sciences (MindTap C...StatisticsISBN:9781305504912Author:Frederick J Gravetter, Larry B. WallnauPublisher:Cengage Learning
  Elementary Statistics: Picturing the World (7th E...StatisticsISBN:9780134683416Author:Ron Larson, Betsy FarberPublisher:PEARSON
 The Basic Practice of StatisticsStatisticsISBN:9781319042578Author:David S. Moore, William I. Notz, Michael A. FlignerPublisher:W. H. Freeman
 Introduction to the Practice of StatisticsStatisticsISBN:9781319013387Author:David S. Moore, George P. McCabe, Bruce A. CraigPublisher:W. H. Freeman
MATLAB: An Introduction with Applications
Statistics
ISBN:9781119256830
Author:Amos Gilat
Publisher:John Wiley & Sons Inc
Probability and Statistics for Engineering and th...
Statistics
ISBN:9781305251809
Author:Jay L. Devore
Publisher:Cengage Learning
Statistics for The Behavioral Sciences (MindTap C...
Statistics
ISBN:9781305504912
Author:Frederick J Gravetter, Larry B. Wallnau
Publisher:Cengage Learning
Elementary Statistics: Picturing the World (7th E...
Statistics
ISBN:9780134683416
Author:Ron Larson, Betsy Farber
Publisher:PEARSON
The Basic Practice of Statistics
Statistics
ISBN:9781319042578
Author:David S. Moore, William I. Notz, Michael A. Fligner
Publisher:W. H. Freeman
Introduction to the Practice of Statistics
Statistics
ISBN:9781319013387
Author:David S. Moore, George P. McCabe, Bruce A. Craig
Publisher:W. H. Freeman