
MATLAB: An Introduction with Applications
6th Edition
ISBN: 9781119256830
Author: Amos Gilat
Publisher: John Wiley & Sons Inc
expand_more
expand_more
format_list_bulleted
Related questions
Question
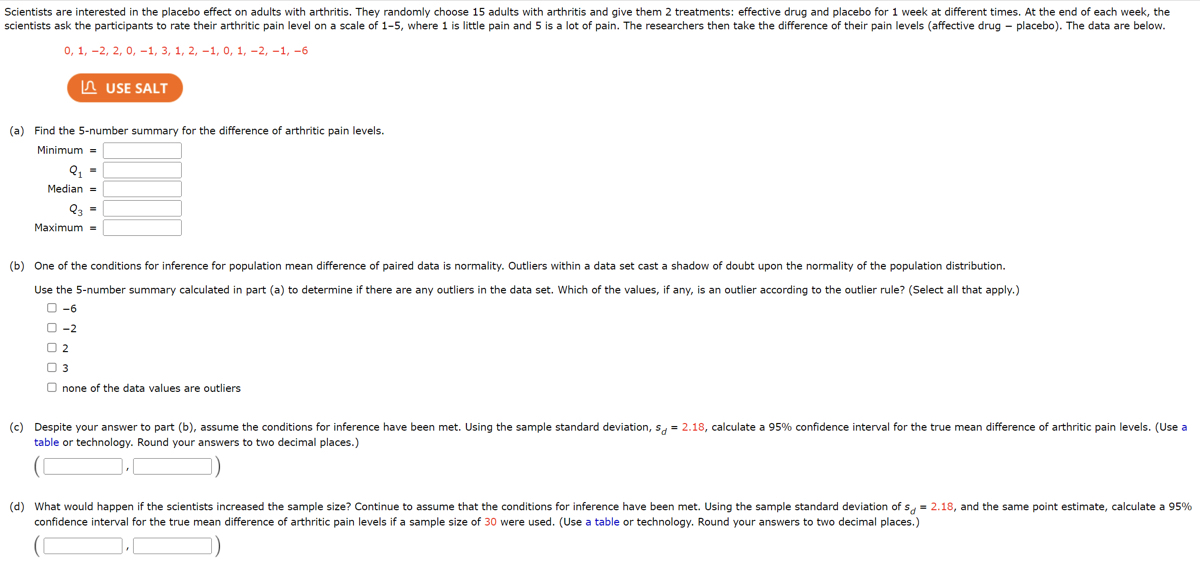

Transcribed Image Text:Scientists are interested in the placebo effect on adults with arthritis. They randomly choose 15 adults with arthritis and give them 2 treatments: effective drug and placebo for 1 week at different times. At the end of each week, the
scientists ask the participants to rate their arthritic pain level on a scale of 1-5, where 1 is little pain and 5 is a lot of pain. The researchers then take the difference of their pain levels (affective drug - placebo). The data are below.
0, 1, 2, 2, 0, -1, 3, 1, 2, -1, 0, 1, -2, -1, -6
(a) Find the 5-number summary for the difference of arthritic pain levels.
Minimum =
Q₁ =
Median =
USE SALT
Q3 =
Maximum =
(b) One of the conditions for inference for population mean difference of paired data is normality. Outliers within a data set cast a shadow of doubt upon the normality of the population distribution.
Use the 5-number summary calculated in part (a) to determine if there are any outliers in the data set. Which of the values, if any, is an outlier according to the outlier rule? (Select all that apply.)
-6
0-2
02
03
3
none of the data values are outliers
(c) Despite your answer to part (b), assume the conditions for inference have been met. Using the sample standard deviation, s = 2.18, calculate a 95% confidence interval for the true mean difference of arthritic pain levels. (Use a
table or technology. Round your answers to two decimal places.)
(d) What would happen if the scientists increased the sample size? Continue to assume that the conditions for inference have been met. Using the sample standard deviation of s= 2.18, and the same point estimate, calculate a 95%
confidence interval for the true mean difference of arthritic pain levels if a sample size of 30 were used. (Use a table or technology. Round your answers to two decimal places.)
Expert Solution
This question has been solved!
Explore an expertly crafted, step-by-step solution for a thorough understanding of key concepts.

Step by stepSolved in 5 steps with 16 images

Knowledge Booster

Similar questions
- What does the "box" of a box-and-whisker plot encompass? Outliers None of these Minimum and maximum Q1, Q2, Q3arrow_forwardIt is widely claimed that a histogram is skewed to the left when the median is greater than the mean and to the right when the median is less than the mean. But there are exceptions to this claim. Demonstrate this exception by creating a data set that has at least 15 samples and plot the histogram.arrow_forward1. The two plots have similar distrubutions. Are the distrubutions skewed left, approximtly symmetric, or skewed right? 2. Which is greater, the mean or the median, within each plot? Why does this make snese, gicen the type of distrubution you identified in the first part? 3. The population has drastically declined over recent years. Does the data show a difference in bee prefrence towards high quality hives versus how quality hives? Usse statistical evidennce to support your response.arrow_forward
- True or false. If the IQR of a dataset is 0 then any observation smaller than Q1 is classified as an outlier using the 1.5(IQR) rule.arrow_forwardFor the dataset below, do a complete box-and-line plot analysis. 3 15 18 19 23 23 26 27 28 29 50 Your work must include:Quartiles: Q1, Q2, Q3Interquartile range (IQR) Upper Limit Lower Limit Adjacent Values Outliers. If you have outliers,you must explain why they are outliers. Don’t forget to draw the box and line plotarrow_forwardWhat is the slope of the median median line for the dataset in this table?arrow_forward
- For a box plot, here are 4 values at the low end of a dataset and 4 values near the high end of a set of dataset: 18, 18, 18, 18 ... 23, 23, 25, 25, ... If the lower fence or boundary for outlier determination is 16 and the upper fence or boundary is 24, what value would you connect the whisker to on the high side of the "box?"arrow_forwardExercise 6. Below is a box plot of life expectancy in years for 142 countries in 2007. Life Expectancy (years) 80 70 60 50 40 (a) Using the box plot, estimate Q1, the median, Q3, and the IQR. Also, are there any potential outliers? (b) What characteristics of the distribution are apparent in the histogram, but not in the box plot? 2arrow_forwardDescribe the natures of the two distributions (uniform, normal, skewed left, skewed right), and identify possible outliers.arrow_forward
- Are there any mild outliers in the college students data? Show all work. Construct and label a modified boxplot for the college students data.arrow_forwardChoose a correct statement. Leverage means a gap between a data point that is unusual in OLS models. O Discrepancy means how far away an observation is from other observations. c. Cook's distance measures discrepancy. Influential outliers can be calculated by discrepancy X leverage. O Cook's distance measures discrepancy.arrow_forward
arrow_back_ios
arrow_forward_ios
Recommended textbooks for you
- MATLAB: An Introduction with ApplicationsStatisticsISBN:9781119256830Author:Amos GilatPublisher:John Wiley & Sons Inc
 Probability and Statistics for Engineering and th...StatisticsISBN:9781305251809Author:Jay L. DevorePublisher:Cengage Learning
 Statistics for The Behavioral Sciences (MindTap C...StatisticsISBN:9781305504912Author:Frederick J Gravetter, Larry B. WallnauPublisher:Cengage Learning
  Elementary Statistics: Picturing the World (7th E...StatisticsISBN:9780134683416Author:Ron Larson, Betsy FarberPublisher:PEARSON
 The Basic Practice of StatisticsStatisticsISBN:9781319042578Author:David S. Moore, William I. Notz, Michael A. FlignerPublisher:W. H. Freeman
 Introduction to the Practice of StatisticsStatisticsISBN:9781319013387Author:David S. Moore, George P. McCabe, Bruce A. CraigPublisher:W. H. Freeman
MATLAB: An Introduction with Applications
Statistics
ISBN:9781119256830
Author:Amos Gilat
Publisher:John Wiley & Sons Inc
Probability and Statistics for Engineering and th...
Statistics
ISBN:9781305251809
Author:Jay L. Devore
Publisher:Cengage Learning
Statistics for The Behavioral Sciences (MindTap C...
Statistics
ISBN:9781305504912
Author:Frederick J Gravetter, Larry B. Wallnau
Publisher:Cengage Learning
Elementary Statistics: Picturing the World (7th E...
Statistics
ISBN:9780134683416
Author:Ron Larson, Betsy Farber
Publisher:PEARSON
The Basic Practice of Statistics
Statistics
ISBN:9781319042578
Author:David S. Moore, William I. Notz, Michael A. Fligner
Publisher:W. H. Freeman
Introduction to the Practice of Statistics
Statistics
ISBN:9781319013387
Author:David S. Moore, George P. McCabe, Bruce A. Craig
Publisher:W. H. Freeman