
MATLAB: An Introduction with Applications
6th Edition
ISBN: 9781119256830
Author: Amos Gilat
Publisher: John Wiley & Sons Inc
expand_more
expand_more
format_list_bulleted
Related questions
Question
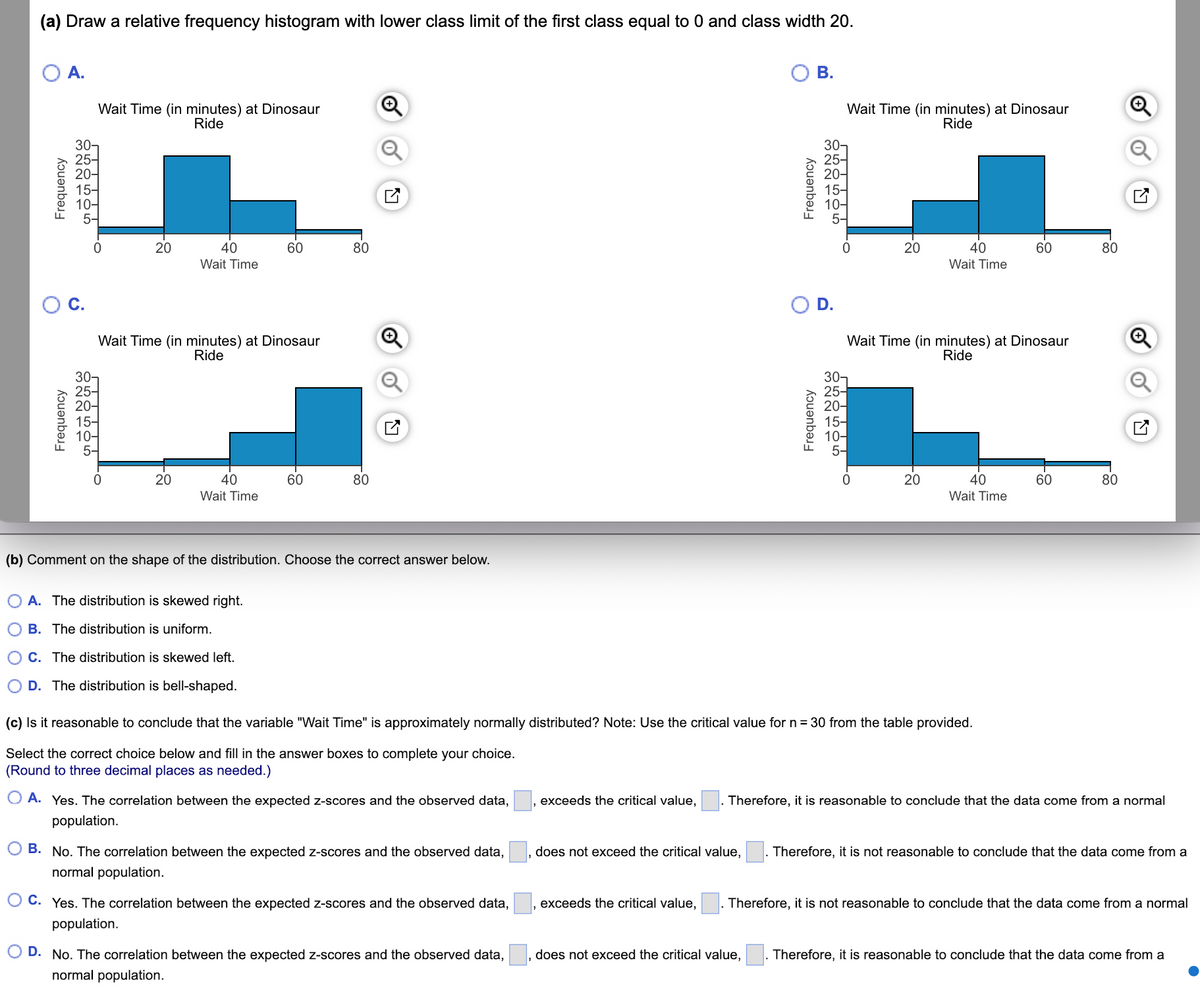

Transcribed Image Text:(a) Draw a relative frequency histogram with lower class limit of the first class equal to 0 and class width 20.
A.
Frequency
O C.
Frequency
Wait Time (in minutes) at Dinosaur
Ride
30-
25-
20-
15-
10-
5-
30-
25-
20-
20
15-
10-
5-
Wait Time (in minutes) at Dinosaur
Ride
40
Wait Time
20
40
Wait Time
60
A. The distribution is skewed right.
B. The distribution is uniform.
C. The distribution is skewed left.
O D. The distribution is bell-shaped.
60
80
80
(b) Comment on the shape of the distribution. Choose the correct answer below.
OA. Yes. The correlation between the expected z-scores and the observed data,
population.
B. No. The correlation between the expected z-scores and the observed data,
normal population.
OC. Yes. The correlation between the expected z-scores and the observed data,
population.
D. No. The correlation between the expected z-scores and the observed data,
normal population.
exceeds the critical value,
does not exceed the critical value,
exceeds the critical value,
Frequency
O
Frequency
does not exceed the critical value,
B.
Wait Time (in minutes) at Dinosaur
Ride
30-
25-
20-
15-
10-
5-
D.
0
(c) Is it reasonable to conclude that the variable "Wait Time" is approximately normally distributed? Note: Use the critical value for n = 30 from the table provided.
Select the correct choice below and fill in the answer boxes to complete your choice.
(Round to three decimal places as needed.)
30-
25-
20-
20
15-
10-
5-
Wait Time (in minutes) at Dinosaur
Ride
40
Wait Time
20
40
Wait Time
60
60
80
Therefore, it is reasonable to conclude that the data come from a normal
80
Therefore, it is not reasonable to conclude that the data come from a
Therefore, it is not reasonable to conclude that the data come from a normal
Therefore, it is reasonable to conclude that the data come from a

Transcribed Image Text:Wait Times
8
BUNNY NOON6
∞∞060555
Nalala
27
32
45
Wait Times
11 9 5
52
7
2
8
8
OSENSOO
8 26
6 29
11 23
20
12 29
16 36
10
9 16
28
63
31
4 10 38
8
U
Critical Values
Sample Size, n Critical Value
5
0.880
6
0.888
7
0.898
8
0.906
9
0.912
10
0.918
11
0.923
12
0.928
13
0.932
14
0.935
15
0.939
16
0.941
17
0.944
18
19
20
21
22
23
24
25
30
0.946
0.949
0.951
0.952
0.954
0.956
0.957
0.959
0.960
Expert Solution
This question has been solved!
Explore an expertly crafted, step-by-step solution for a thorough understanding of key concepts.

This is a popular solution

Trending nowThis is a popular solution!

Step by stepSolved in 5 steps with 2 images

Knowledge Booster

Similar questions
- 4). Using the data in the question #2, construct a histogram and then construct a frequency polygon.arrow_forward5. The female students in an undergraduate engineering core course at UH self-reported their heights to the nearest inch. The data is as follows. 62 64 61 67 65 68 61 65 60 65 64 63 59 68 64 66 68 69 65 67 62 66 68 67 66 65 69 65 69 65 67 67 65 63 64 67 65 First construct the frequency distribution Table like Table 6-4 on Page 213 of textbook where you only need to specify the classes/bins, frequency info. Then using the table to create the histogram; here let the height of rectangle (for each bin) equal to the frequency instead of relative frequency in your histogram even though you can also set the height as the relative frequency. Hint: create the frequency distribution table by hand, but you can create the histogram in Excel and insert the result as a figure.arrow_forwardResting Pulse: earlier this semester we determined our resting pulse. Seventy-nine individuals participated in this data collection. The mean heart rate for all individuals was 65.34 beats per minute. A random sample of 30 heart rates having a mean of 64.97 beats per minute is presented here. Build a frequency table of these data containing six (6) classes with the lower llimit of the second class at 54 beats per minute. Build a chart appropriate for the presentation of these data. Data: 49, 51, 53, 56, 57, 58, 60 , 60, 62, 62, 62, 64, 64 65, 65 , 65, 67, 68, 68, 68, 69, 70 , 70, 72, 72, 72, 72, 75, 75 , 78,arrow_forward
- How is a frequency distribution chart incorrectly constructed?arrow_forwardComplete the following frequency chart.A frequency chart of temperatures Temperature Frequency Relative Frequency 70 - 74 75 - 79 80 - 84 85 - 89 90 - 94 From the frequency chart, calculate the mean. How does the mean from the raw data (question 7) compare to the mean from the grouped data (question 9)? Use the frequency chart to create a histogram of the daily high temperatures at Cox-Dayton International Airport for June and July 2018. Describe the distribution by shape, center, and spread. Also, state whether there are any outliers.arrow_forward8.Suppose you compare the mean of raw data and the mean of the same raw data grouped into a frequency distribution. These two means will be a. Exactly equal. b. The same as the median. c. The same as the geometric mean. d. Approximately equal.arrow_forward
arrow_back_ios
arrow_forward_ios
Recommended textbooks for you
- MATLAB: An Introduction with ApplicationsStatisticsISBN:9781119256830Author:Amos GilatPublisher:John Wiley & Sons Inc
 Probability and Statistics for Engineering and th...StatisticsISBN:9781305251809Author:Jay L. DevorePublisher:Cengage Learning
 Statistics for The Behavioral Sciences (MindTap C...StatisticsISBN:9781305504912Author:Frederick J Gravetter, Larry B. WallnauPublisher:Cengage Learning
  Elementary Statistics: Picturing the World (7th E...StatisticsISBN:9780134683416Author:Ron Larson, Betsy FarberPublisher:PEARSON
 The Basic Practice of StatisticsStatisticsISBN:9781319042578Author:David S. Moore, William I. Notz, Michael A. FlignerPublisher:W. H. Freeman
 Introduction to the Practice of StatisticsStatisticsISBN:9781319013387Author:David S. Moore, George P. McCabe, Bruce A. CraigPublisher:W. H. Freeman
MATLAB: An Introduction with Applications
Statistics
ISBN:9781119256830
Author:Amos Gilat
Publisher:John Wiley & Sons Inc
Probability and Statistics for Engineering and th...
Statistics
ISBN:9781305251809
Author:Jay L. Devore
Publisher:Cengage Learning
Statistics for The Behavioral Sciences (MindTap C...
Statistics
ISBN:9781305504912
Author:Frederick J Gravetter, Larry B. Wallnau
Publisher:Cengage Learning
Elementary Statistics: Picturing the World (7th E...
Statistics
ISBN:9780134683416
Author:Ron Larson, Betsy Farber
Publisher:PEARSON
The Basic Practice of Statistics
Statistics
ISBN:9781319042578
Author:David S. Moore, William I. Notz, Michael A. Fligner
Publisher:W. H. Freeman
Introduction to the Practice of Statistics
Statistics
ISBN:9781319013387
Author:David S. Moore, George P. McCabe, Bruce A. Craig
Publisher:W. H. Freeman