MATLAB: An Introduction with Applications
6th Edition
ISBN: 9781119256830
Author: Amos Gilat
Publisher: John Wiley & Sons Inc
expand_more
expand_more
format_list_bulleted
Concept explainers
Topic Video
Question

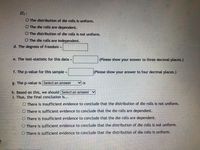
Transcribed Image Text:H1:
O The distribution of die rolls is uniformn.
O The die rolls are dependent.
O The distribution of die rolls is not untform.
O The die rolls are independent.
d. The degrees of freedom =
e. The test-statistic for this data =
(Please show your answer to three decimal places.)
f. The p-value for this sample
(Please show your answer to four decimal places.)
%3D
g. The p-value is Select an answer
h. Based on this, we should Select an answer
1. Thus, the final conclusion is...
O There is insufficient evidence to conclude that the distribution of die rolls is not uniform.
O There is sufficient evidence to conclude that the die rolls are dependent.
O There is insufficient evidence to conclude that the die rolls are dependent.
O There is sufficient evidence to conclude that the distribution of die rolls is not uniform.
O There is sufficient evidence to conclude that the distribution of die rolls is uniform.

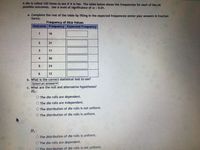
Transcribed Image Text:A die is rolled 120 times to see if it is falr. The table below shows the frequencies for each of the six
possible outcomes. Use a level of significance of a = 0.01.
a. Complete the rest of the table by filling in the expected frequencies (enter your answers in fraction
form):
Frequency of Dice Values
Outcome Frequency Expected Frequency
16
2
31
3
11
4
26
24
6.
12
b. What is the correct statistical test to use?
Select an answerv
c. What are the null and alternative hypotheses?
Ho:
O The die rolls are dependent.
O The die rolls are independent.
O The distribution of die rolls is not uniform.
O The distribution of die rolls is uniform.
H1 :
The distribution of die rolls is uniform.
O The die rolls are dependent.
O The distribution of die rolls is not uniform.
Expert Solution
This question has been solved!
Explore an expertly crafted, step-by-step solution for a thorough understanding of key concepts.
Step by stepSolved in 2 steps

Knowledge Booster
Learn more about
Need a deep-dive on the concept behind this application? Look no further. Learn more about this topic, statistics and related others by exploring similar questions and additional content below.Similar questions
- A die is rolled 120 times to see if it is fair. The table below shows the frequencies for each of the six possible outcomes. Use a level of significance of cx = 0.05. a. Complete the rest of the table by filling in the expected frequencies (enter your answers in fraction form): Frequency of Dice Values Outcome Frequency Expected Frequency 1 2 3 4 5 24 15 26 19 24 6 12 b. What is the correct statistical test to use? Select an answer ✓ c. What are the null and alternative hypotheses? Ho: The die rolls are independent. The die rolls are dependent. The distribution of die rolls is not uniform. O The distribution of die rolls is uniform. H₂: O The distribution of die rolls is uniform. The die rolls are independent. The distribution of die rolls is not uniform. O The die rolls are dependent. d. The degrees of freedom = e. The test-statistic for this data = f. The p-value for this sample= (Please show your answer to three decimal places.) (Please show your answer to four decimal places.)arrow_forwardDrop down options are as follows: a. z test or t test b. u or p, <,>,= or not equal to c. z or tarrow_forwardWhat is the name of the test used?arrow_forward
- tou want to see if it makes a difference which lane to be in when there is traffic. You randomly observe 328 cars pass by on the four lane freeway. The results are displayed in the table below. Use a level of significance of a 010 a. Complete the rest of the table by filling in the expected frequencies: Frequency of Cars in Each Lane Outcome Frequency Expected Frequency Lane 1 94 Lane 2 63 Lane 3 101 Lane 4 70 b. What is the correct statistical test to use? Select an answer v c. What are the null and alternative hypotheses? Ho: The traffic and lanes are independent. The distribution of traffic is not uniform. The traffic and lanes are dependent. The distribution of traffic is uniform.arrow_forwardQue On the right are ratings for passers in a football league. Find the three quartiles for the ratings. Passer Rating Points O Martinez 101.5 What is Q,? Washington 94.8 Abdoullah 92.8 Schmidt 85.2 Jarvis 84.1 Jefferson 80.5 Roddick 79.6 Singh 77.8 Goldman 77.1 Harvey 75.5 !!arrow_forward20 computer screens were randomly selected from a large collection of computer screens in a company’s warehouse. These 20 computer screens are referred to as the: test statistic. parameter. population. sample.arrow_forward
- A die is rolled 120 times to see if it is fair. The table below shows the frequencies for each of the six possible outcomes. Use a level of significance of a = = 0.05. a. Complete the rest of the table by filling in the expected frequencies (enter your answers in fraction form): Frequency of Dice Values Outcome Frequency Expected Frequency 1 2 3 4 5 17 27 19 23 12 6 b. What is the correct statistical test to use? Goodness-of-Fit C c. What are the null and alternative hypotheses? Ho: 22 The die rolls are independent. The die rolls are dependent. The distribution of die rolls is not uniform. The distribution of die rolls is uniform.arrow_forwardA professor has twelve students in her class. Her class took a test with the following results: 73, 55, 72, 98, 77, 93, 58, 78, 79, 95, 96, 86 a. What was the mean grade on the test? (Simplify your answer and round to one decimal place.) b. What was the median grade on the test? (Simplify your answer and round to one decimal place.) C c. What was the mode? If there are no modes, enter “NONE”. Otherwise, enter the mode (or modes, separated by a comma). Mode(s) = $ Mean = 5 4 I Median = JO D f V % 5 t 6.0 b 6 Oll y h & 7 n u - * 00 8 m ( 9 k S O n L O A р alt 7 + [ // ctriarrow_forwardA Likert Scale is a tool used in many sample surveys to collect opinions on a statement. In this exercise you are asked to use a scale that runs from 5=strongly agree 4-agree 3-neither agree nor disagree 2-disagree 1-strongly disagree What sort of data is a Likert Scale, and why?arrow_forward
arrow_back_ios
SEE MORE QUESTIONS
arrow_forward_ios
Recommended textbooks for you
 MATLAB: An Introduction with ApplicationsStatisticsISBN:9781119256830Author:Amos GilatPublisher:John Wiley & Sons Inc
 Probability and Statistics for Engineering and th...StatisticsISBN:9781305251809Author:Jay L. DevorePublisher:Cengage Learning
 Statistics for The Behavioral Sciences (MindTap C...StatisticsISBN:9781305504912Author:Frederick J Gravetter, Larry B. WallnauPublisher:Cengage Learning
 Elementary Statistics: Picturing the World (7th E...StatisticsISBN:9780134683416Author:Ron Larson, Betsy FarberPublisher:PEARSON
 The Basic Practice of StatisticsStatisticsISBN:9781319042578Author:David S. Moore, William I. Notz, Michael A. FlignerPublisher:W. H. Freeman
 Introduction to the Practice of StatisticsStatisticsISBN:9781319013387Author:David S. Moore, George P. McCabe, Bruce A. CraigPublisher:W. H. Freeman

MATLAB: An Introduction with Applications
Statistics
ISBN:9781119256830
Author:Amos Gilat
Publisher:John Wiley & Sons Inc

Probability and Statistics for Engineering and th...
Statistics
ISBN:9781305251809
Author:Jay L. Devore
Publisher:Cengage Learning

Statistics for The Behavioral Sciences (MindTap C...
Statistics
ISBN:9781305504912
Author:Frederick J Gravetter, Larry B. Wallnau
Publisher:Cengage Learning

Elementary Statistics: Picturing the World (7th E...
Statistics
ISBN:9780134683416
Author:Ron Larson, Betsy Farber
Publisher:PEARSON

The Basic Practice of Statistics
Statistics
ISBN:9781319042578
Author:David S. Moore, William I. Notz, Michael A. Fligner
Publisher:W. H. Freeman

Introduction to the Practice of Statistics
Statistics
ISBN:9781319013387
Author:David S. Moore, George P. McCabe, Bruce A. Craig
Publisher:W. H. Freeman