
MATLAB: An Introduction with Applications
6th Edition
ISBN: 9781119256830
Author: Amos Gilat
Publisher: John Wiley & Sons Inc
expand_more
expand_more
format_list_bulleted
Related questions
Question
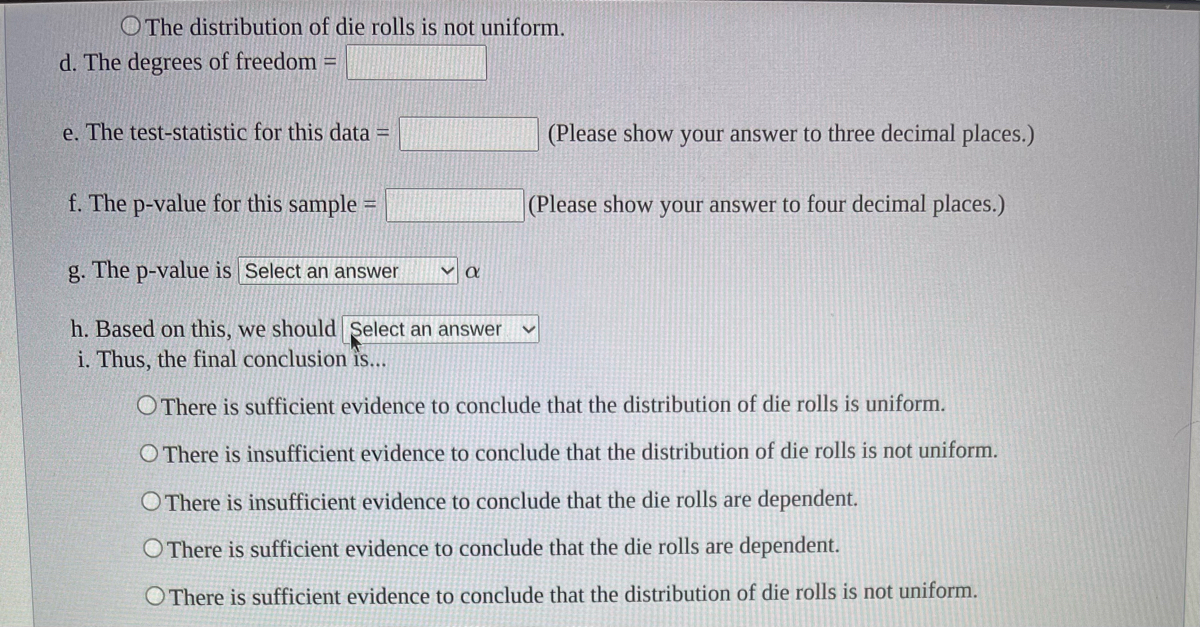

Transcribed Image Text:The distribution of die rolls is not uniform.
d. The degrees of freedom =
e. The test-statistic for this data =
f. The p-value for this sample=
g. The p-value is Select an answer
h. Based on this, we should Select an answer
i. Thus, the final conclusion is...
α
(Please show your answer to three decimal places.)
(Please show your answer to four decimal places.)
There is sufficient evidence to conclude that the distribution of die rolls is uniform.
O There is insufficient evidence to conclude that the distribution of die rolls is not uniform.
O There is insufficient evidence to conclude that the die rolls are dependent.
O There is sufficient evidence to conclude that the die rolls are dependent.
There is sufficient evidence to conclude that the distribution of die rolls is not uniform.

Transcribed Image Text:A die is rolled 120 times to see if it is fair. The table below shows the frequencies for each of the six possible outcomes.
Use a level of significance of a = 0.05.
a. Complete the rest of the table by filling in the expected frequencies (enter your answers in fraction form):
Frequency of Dice Values
Outcome Frequency Expected Frequency
1
2
3
4
LO
5
30
17
19
H₁:
14
21
6
19
b. What is the correct statistical test to use?
Select an answer
c. What are the null and alternative hypotheses?
Ho:
O The die rolls are independent.
O The die rolls are dependent.
O The distribution of die rolls is uniform.
O The distribution of die rolls is not uniform.
O The die rolls are independent.
O The distribution of die rolls is uniform.
O The die rolls are dependent.
O The distribution of die rolls is not uniform.
d. The degrees of freedom =
e. The test-statistic for this data =
(Please show your answer to three decimal places.)
Expert Solution
This question has been solved!
Explore an expertly crafted, step-by-step solution for a thorough understanding of key concepts.

This is a popular solution

Trending nowThis is a popular solution!

Step by stepSolved in 3 steps with 3 images

Knowledge Booster

Similar questions
- College graduates in a random sample were asked the age when they earned their bachelor's degree. The data are summarized in the frequency table below. Find the mean of the sample. Submit your answer as a decimal value rounded to the nearest tenth. Frequency table: Count of the age when students graduated with a bachelor's degree Age 21 22 23 24 25 26 Frequency 1 3 4 2 O 9arrow_forwardA survey of 100 fatal accidents showed that 26 were alcohol related. Find a point estimate for p, the population proportion of accidents that were alcohol related. O A. 0.351 ОВ. 0.74 O C. 0.206 O D. 0.26arrow_forwardWhat is the total number of scores for the distribution shown in the following table? X f 4 1 3 3 2 7 1 2 Select one: a. 14 b. 13 c. 11 d. 24arrow_forward
- I can't understand why the data is the percentage of surveyed parents.arrow_forwardFor the sample scores in the frequency distribution table below, the median is 1 4 4. 1 1 1 3.arrow_forwardA survey asked a group of people the size of their households. The results are shown in the frequency distribution. What is the mean of the frequency distribution? Household size 25 2 3 4 5 16.4 3.28 2arrow_forward
- A. Determine the coefficient of determination, r2, and interpret its meaning. (Fill in the Blank) r2 = ___? (Round to four decimal places as needed.) B. What is the meaning of the coefficient ofdetermination? (Choose Below) A. It measures the variability in the actual plate gap from the predicted plate gap. B. It measures the variability in the actual tear rating from the predicted tear rating. C. It is the proportion of the variation in the plate gap that is explained by the variability in the tear rating. D. It is the proportion of the variation in the tear rating that is explained by the variability in the plate gap. C. Determine the standard error of the estimate. SYX = ___? (Round to four decimal places asneeded.)arrow_forwardA survey of 2,510 golfers showed that 311 of them are left-handed. Find a point estimate for p, the population proportion of golfers that are left-handed. A. 0.11 B. 0.124 C. 0.141 D. 0.876arrow_forwardHere are several z-scores. Which person scored furthest from average? Ahab: Z = +1.2 Brianna: Z = -0.8 Cecilia: Z = -1.4 Darnell: Z = +0.7 Evelyn: Z = +0.2 Group of answer choices Brianna Cecilia Cannot tell from the information given Evelyn Darnell Ahabarrow_forward
- What is the mean for the following scores: 2, 5, 4, 1, 8? A. 3 B. 4 C. 5 D. 20arrow_forwardA teacher surveyed 11 students for how many days per week they have read newspaper. The result is shown as follows: 1 1 1 2 2 2 2 5 6 6 6 (a) Find the mean. (b) Find the median. (c) Find the mode.arrow_forwardA group of students were surveyed about the number of siblings they have. Their responses are summarized in the frequency table below. How many students responded to the survey? Number of Siblings Frequency 0 6 1 8 2 5 3 3 4 1 5 or more 3arrow_forward
arrow_back_ios
SEE MORE QUESTIONS
arrow_forward_ios
Recommended textbooks for you
- MATLAB: An Introduction with ApplicationsStatisticsISBN:9781119256830Author:Amos GilatPublisher:John Wiley & Sons Inc
 Probability and Statistics for Engineering and th...StatisticsISBN:9781305251809Author:Jay L. DevorePublisher:Cengage Learning
 Statistics for The Behavioral Sciences (MindTap C...StatisticsISBN:9781305504912Author:Frederick J Gravetter, Larry B. WallnauPublisher:Cengage Learning
  Elementary Statistics: Picturing the World (7th E...StatisticsISBN:9780134683416Author:Ron Larson, Betsy FarberPublisher:PEARSON
 The Basic Practice of StatisticsStatisticsISBN:9781319042578Author:David S. Moore, William I. Notz, Michael A. FlignerPublisher:W. H. Freeman
 Introduction to the Practice of StatisticsStatisticsISBN:9781319013387Author:David S. Moore, George P. McCabe, Bruce A. CraigPublisher:W. H. Freeman
MATLAB: An Introduction with Applications
Statistics
ISBN:9781119256830
Author:Amos Gilat
Publisher:John Wiley & Sons Inc
Probability and Statistics for Engineering and th...
Statistics
ISBN:9781305251809
Author:Jay L. Devore
Publisher:Cengage Learning
Statistics for The Behavioral Sciences (MindTap C...
Statistics
ISBN:9781305504912
Author:Frederick J Gravetter, Larry B. Wallnau
Publisher:Cengage Learning
Elementary Statistics: Picturing the World (7th E...
Statistics
ISBN:9780134683416
Author:Ron Larson, Betsy Farber
Publisher:PEARSON
The Basic Practice of Statistics
Statistics
ISBN:9781319042578
Author:David S. Moore, William I. Notz, Michael A. Fligner
Publisher:W. H. Freeman
Introduction to the Practice of Statistics
Statistics
ISBN:9781319013387
Author:David S. Moore, George P. McCabe, Bruce A. Craig
Publisher:W. H. Freeman