
MATLAB: An Introduction with Applications
6th Edition
ISBN: 9781119256830
Author: Amos Gilat
Publisher: John Wiley & Sons Inc
expand_more
expand_more
format_list_bulleted
Related questions
Question
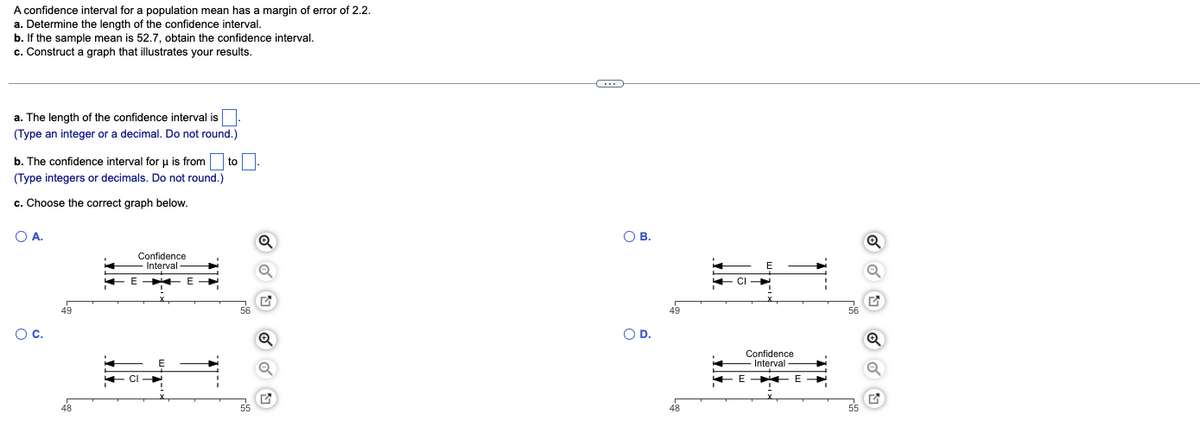

Transcribed Image Text:A confidence interval for a population mean has a margin of error of 2.2.
a. Determine the length of the confidence interval.
b. If the sample mean is 52.7, obtain the confidence interval.
c. Construct a graph that illustrates your results.
a. The length of the confidence interval is.
(Type an integer or a decimal. Do not round.)
b. The confidence interval for μ is from to.
(Type integers or decimals. Do not round.)
c. Choose the correct graph below.
O A.
O C.
48
Confidence
Interval
CI
M
G
-C...
O B.
O D.
CI
H
Confidence
Interval
EE
55
Q
G
B
Expert Solution
This question has been solved!
Explore an expertly crafted, step-by-step solution for a thorough understanding of key concepts.

This is a popular solution

Trending nowThis is a popular solution!

Step by stepSolved in 2 steps

Knowledge Booster

Similar questions
- Help Me please.arrow_forwardYou are given the sample mean and the population standard deviation. Use this information to construct the 90% and 95% confidence intervals for the population mean. Interpret the results and compare the widths of the confidence intervals. If convenient, use technology to construct the confidence intervals. A random sample of 40 home theater systems has a mean price of $149.00. Assume the population standard deviation is $19.30. Construct a 90% confidence interval for the population mean. The 90% confidence interval is (Round to two decimal places as needed.) Construct a 95% confidence interval for the population mean. The 95% confidence interval is (,). (Round to two decimal places as needed.) Interpret the results. Choose the correct answer below. A. With 90% confidence, it can be said that the population mean price lies in the first interval. With 95% confidence, it can be said that the population mean price lies in the second interval. The 95% confidence interval is wider than the…arrow_forwardYou are given the sample mean and the population standard deviation. Use this information to construct the 90% and 95% confidence intervals for the population mean. Interpret the results and compare the widths of the confidence intervals. If convenient, use technology to construct the confidence intervals. A random sample of 35 home theater systems has a mean price of$134.00. Assume the population standard deviation is $18.70. Construct a 90% confidence interval for the population mean. The 90% confidence interval is _____ (Round to two decimal places as needed) Construct a 95% confidence interval for the population mean. The 95% confidence interval is _____ (Round to two decimal places as needed)arrow_forward
- You are given the sample mean and the population standard deviation. Use this information to construct the 90% and 95% confidence intervals for the population mean. Interpret the results and compare the widths of the confidence intervals. If convenient, use technology to construct the confidence intervals. A random sample of 60 home theater systems has a mean price of $125.00. Assume the population standard deviation is $19.30 Construct a 90% confidence interval for the population mean. The 90% confidence interval is___________________________. (Round to two decimal places as needed.)arrow_forwardYou are given the sample mean and the population standard deviation. Use this information to construct the 90% and 95% confidence intervals for the population mean. Interpret the results and compare the widths of the confidence intervals. If convenient, use technology to construct the confidence intervals. A random sample of 55 home theater systems has a mean price of $117.00.Assume the population standard deviation is $17.40. Construct a 90% confidence interval for the population mean. The 90% confidence interval is (enter your response here,enter your response here). (Round to two decimal places as needed.) Construct a 95% confidence interval for the population mean. The 95% confidence interval is (enter your response here,enter your response here). (Round to two decimal places as needed.) Interpret the results. Choose the correct answer below. A. With 90% confidence, it can be said that the population mean price lies in the first…arrow_forwardYou are given the sample mean and the population standard deviation. Use this information to construct the 90% and 95% confidence intervals for the population mean. Interpret the results and compare the widths of the confidence intervals. If convenient, use technology to construct the confidence intervals A random sample of 50 home theater systems has a mean price of $125.00. Assume the population standard deviation is $16.40. Construct a 90% confidence interval for the population mean. The 90% confidence interval is ( | ). (Round to two decimal places as needed.) Construct a 95% confidence interval for the population mean. The 95% confidence interval is ( ) (Round to two decimal places as needed.) Interpret the results. Choose the correct answer below. O A. With 90% confidence, it can be said that the population mean price lies in the first interval. With 95% confidence, it can be said that the population mean price lies in the second interval. The 95% confidence interval is wider…arrow_forward
- You are given the sample mean and the population standard deviation. Use this information to construct the 90% and 95% confidence intervals for the population mean. Interpret the results and compare the widths of the confidence intervals. If convenient, use technology to construct the confidence intervals. A random sample of 35 home theater systems has a mean price of $145.00. Assume the population standard deviation is $18.10. Construct a 90% confidence interval for the population mean. The 90% confidence interval is ( D. (Round to two decimal places as needed.) S... el R... 1o-Insta... PDF DRA 2021 Deputy Incidents.pdf Enter your answer in the edit fields and then click Check Answer. 2 parts remaining Clear All Check Answer Riley LAMAarrow_forwardYou are given the sample mean and the population standard deviation. Use this information to construct the 90% and 95% confidence intervals for the population mean. Interpret the results and compare the widths of the confidence intervals. If convenient, use technology to construct the confidence intervals. A random sample of 40 home theater systems has a mean price of $124.00. Assume the population standard deviation is $19.60. Construct a 90% confidence interval for the population mean. The 90% confidence interval is (Round to two decimal places as needed.)arrow_forwardAssume that population mean is to be estimated from the sample described. Use the sample results to approximate the margin of error and 95% confidence interval. n = 36, x = 64.4 seconds, s = 6.5 seconds. The margin of error is seconds. (Round to one decimal place as needed.) an example 4arrow_forward
- You are given the sample mean and the population standard deviation. Use this information to construct the 90% and 95% confidence intervals for the population mean. Interpret the results and compare the widths of the confidence intervals. If convenient, use technology to construct the confidence intervals. A random sample of 45 home theater systems has a mean price of $142.00. Assume the population standard deviation is $18.80. Construct a 90% confidence interval for the population mean. The 90% confidence interval is (____, ____) (Round to two decimal places as needed.) Construct a 95% confidence interval for the population mean. The 95% confidence interval is (____, ____) (Round to two decimal places as needed.)arrow_forwardYou are given the sample mean and the population standard deviation. Use this information to construct the 90% and 95% confidence intervals for the population mean. Interpret the results and compare the widths of the confidence intervals. If convenient, use technology to construct the confidence intervals. A random sample of 50 home theater systems has a mean price of $118.00. Assume the population standard deviation is $19.60. Construct a 90% confidence interval for the population mean. The 90% confidence interval is ( ). (Round to two decimal places as needed.) Construct a 95% confidence interval for the population mean. The 95% confidence interval is ( ,). (Round to two decimal places as needed.) Interpret the results. Choose the correct answer below. O A. With 90% confidence, it can be said that the population mean price lies in the first interval. With 95% confidence, it can be said that the population mean price lies in the second interval. The 95% confidence interval is wider…arrow_forwardYou are given the sample mean and the population standard deviation. Use this information to construct the 90% and 95% confidence intervals for the population mean. Interpret the results and compare the widths of the confidence intervals. If convenient, use technology to construct the confidence intervals. A random sample of 60 home theater systems has a mean price of $110.00. Assume the population standard deviation is $17.20. Construct a 90% confidence interval for the population mean. The 90% confidence interval is ( (Round to two decimal places as needed.)arrow_forward
arrow_back_ios
SEE MORE QUESTIONS
arrow_forward_ios
Recommended textbooks for you
- MATLAB: An Introduction with ApplicationsStatisticsISBN:9781119256830Author:Amos GilatPublisher:John Wiley & Sons Inc
 Probability and Statistics for Engineering and th...StatisticsISBN:9781305251809Author:Jay L. DevorePublisher:Cengage Learning
 Statistics for The Behavioral Sciences (MindTap C...StatisticsISBN:9781305504912Author:Frederick J Gravetter, Larry B. WallnauPublisher:Cengage Learning
  Elementary Statistics: Picturing the World (7th E...StatisticsISBN:9780134683416Author:Ron Larson, Betsy FarberPublisher:PEARSON
 The Basic Practice of StatisticsStatisticsISBN:9781319042578Author:David S. Moore, William I. Notz, Michael A. FlignerPublisher:W. H. Freeman
 Introduction to the Practice of StatisticsStatisticsISBN:9781319013387Author:David S. Moore, George P. McCabe, Bruce A. CraigPublisher:W. H. Freeman
MATLAB: An Introduction with Applications
Statistics
ISBN:9781119256830
Author:Amos Gilat
Publisher:John Wiley & Sons Inc
Probability and Statistics for Engineering and th...
Statistics
ISBN:9781305251809
Author:Jay L. Devore
Publisher:Cengage Learning
Statistics for The Behavioral Sciences (MindTap C...
Statistics
ISBN:9781305504912
Author:Frederick J Gravetter, Larry B. Wallnau
Publisher:Cengage Learning
Elementary Statistics: Picturing the World (7th E...
Statistics
ISBN:9780134683416
Author:Ron Larson, Betsy Farber
Publisher:PEARSON
The Basic Practice of Statistics
Statistics
ISBN:9781319042578
Author:David S. Moore, William I. Notz, Michael A. Fligner
Publisher:W. H. Freeman
Introduction to the Practice of Statistics
Statistics
ISBN:9781319013387
Author:David S. Moore, George P. McCabe, Bruce A. Craig
Publisher:W. H. Freeman