
MATLAB: An Introduction with Applications
6th Edition
ISBN: 9781119256830
Author: Amos Gilat
Publisher: John Wiley & Sons Inc
expand_more
expand_more
format_list_bulleted
Related questions
Question
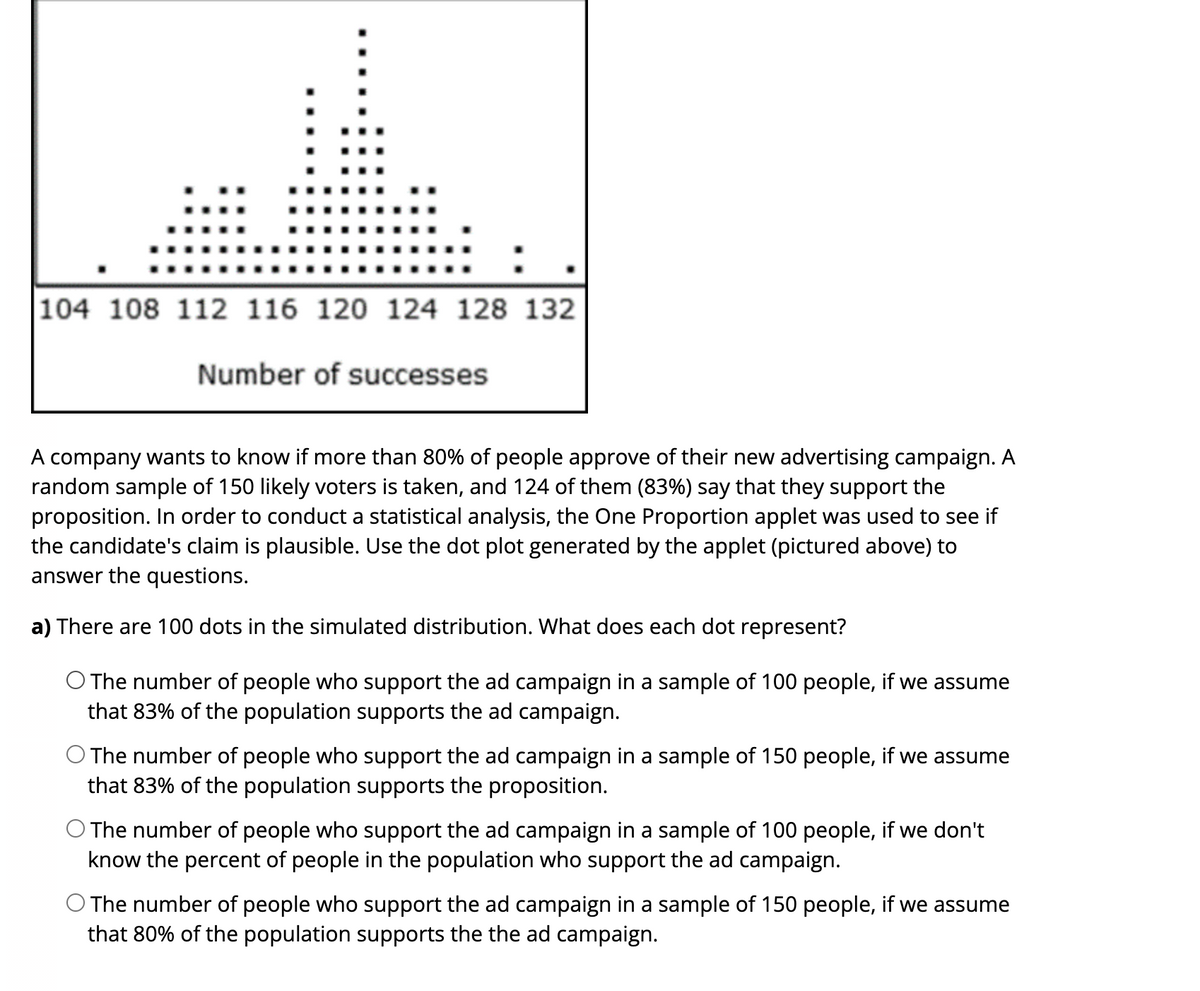

Transcribed Image Text:104 108 112 116 120 124 128 132
Number of successes
A company wants to know if more than 80% of people approve of their new advertising campaign. A
random sample of 150 likely voters is taken, and 124 of them (83%) say that they support the
proposition. In order to conduct a statistical analysis, the One Proportion applet was used to see if
the candidate's claim is plausible. Use the dot plot generated by the applet (pictured above) to
answer the questions.
a) There are 100 dots in the simulated distribution. What does each dot represent?
O The number of people who support the ad campaign in a sample of 100 people, if we assume
that 83% of the population supports the ad campaign.
The number of people who support the ad campaign in a sample of 150 people, if we assume
that 83% of the population supports the proposition.
O The number of people who support the ad campaign in a sample of 100 people, if we don't
know the percent of people in the population who support the ad campaign.
The number of people who support the ad campaign in a sample of 150 people, if we assume
that 80% of the population supports the the ad campaign.

Transcribed Image Text:b) If we switched the applet to display "Proportion of successes" then what value would the
distribution be centered at?
O 0.8
150
130
O 0.87
c) Is the observed statistic "usual/expected" or is it "unusual/unexpected" in this simulated
distribution of sample statistics?
O Usual/expected because 80% is pretty close to 83%.
Unusual/unexpected because it is in the tail of the distribution.
O Usual/expected in this distribution.
d) Which of the following conclusions is the most accurate to make based on our observed statistic?
Because our statistic is unusual/unexpected, we have strong evidence that the ad campaign
has more than 80% support in the population.
O We conclude that the ad campaign has 80% support in the population.
We conclude that the proposition has 83% support in the population.
Because our statistic is usual/expected, it is plausible that the ad campaign has 80% support
in the population.
Question Help: Video
> Next Question
Expert Solution
This question has been solved!
Explore an expertly crafted, step-by-step solution for a thorough understanding of key concepts.

This is a popular solution

Trending nowThis is a popular solution!

Step by stepSolved in 2 steps

Knowledge Booster

Similar questions
- Is the variable(foot print) below normally distributed or skewed? If skewed, indicate the direction. male shoe print #1 32.2 #2 30.1 #3 29.0 #4 31.8 #5 29.4arrow_forwardDraw a scatter plot for the data in the following table. -4 -3 -2 -1 0 1 2 3 4 LO y 0.5 3 4.8 6 7.1 7.2 8.3 8.9 9 9.9 9 8 7 6 5 4 3 21 + -4-3 -2 -1 1 2 3 4 5 Clear All Draw: Dotarrow_forward5. Suppose that 25 students in a science class took a test. Using the box-and-whisker plot of the test scores below, answer the following questions. A. Determine whether the statement is true (T) or false (F). Science Test Scores a) The mean of the scores is 81. b) The mean of the scores is 78.6. c) About 50% of the students received a score of 81. d) More than 50% of the students received a score above 73. 54 73 81 90 95 + 40 50 60 70 80 90 100 GFreemathresource.com Answer: a) b) c) d) B. If a student received a score of 10 instead of 54, would it more heavily influence the mean or the median? Мean Median C. If a student received a score of 10 instead of 54, the standard deviation would be most likely: Smaller Larger Little Changedarrow_forward
- The following data are the scores of 19 students on an algebra test. 62 , 84 , 87 , 92 , 55 , 75 , 85 , 63 , 58 , 70 , 60 , 86 , 95 , 61 , 92 , 65 , 84 , 75 , 64 Send data to calculator Send data to Excel Using the tool provided, construct a box-and-whisker plot (sometimes called a boxplot) for the data. 55 60 65 70 75 80 85 90 95 Score on algebra testarrow_forwardBelow are numbers of hours that a sample of 18 recent college graduates reported working last week. 55 48 46 64 68 43 37 44 63 54 45 48 52 39 50 51 65 38 Construct a box and whisker plot for the data.arrow_forwardConsider the GPA of students in class: 1.6,1.7,1.8,1.9,2.4,2.6,2.7,2.8,2.9,3.2,3.3,3.3,3.4,4.0,4.0,4.0,4.0 Construct a stem-and-leaf plot. The leaves corresponding to stem 4 are? What is the rough shape of this data? Please answer both questionsarrow_forward
- The following table presents the daily high temperatures for the city of Macon, Georgia, in degrees Fahrenheit, for the winter months of January and February in a recent year. 58 51 71 58 59 67 52 73 64 64 58 67 53 53 63 75 76 61 52 52 68 67 48 55 69 63 58 56 56 63 74 65 57 53 48 70 76 51 65 60 61 Send data to Excel Construct a stem-and-leaf plot, using the digits 4, 5, 6, and 7 as the stems. Do not separate the answers with a comma. If there are no leaves, select the "None" button. 4 None 5 5 6 7 8 ME ›arrow_forwardb. Calculate the range. Range= c. Calculate the interquartile range, IQR. IQR= d. State whether the distribution is symmetric, skewed left, or skewed right. Symmetric Skewed left Skewed right e. Would you expect the mean to be greater than, equal, or less than the median? Equal Greater than Less thanarrow_forwardThe following table presents the daily high temperatures for the city of Macon, Georgia, in degrees Fahrenheit, for the winter months of January and February in a recent year. 67 52 73 58 51 71 58 59 64 64 58 67 53 53 63 75 76 61 52 52 68 67 48 55 69 63 58 56 56 63 74 65 57 53 48 70 76 51 65 60 61 Send data to Excel Construct a stem-and-leaf plot, using the digits 4, 5, 6, and 7 as the stems. Do not separate the answers with a comma. If there are no leaves, select the "None" button. 4 None 5 6 S 7 Xarrow_forward
arrow_back_ios
arrow_forward_ios
Recommended textbooks for you
- MATLAB: An Introduction with ApplicationsStatisticsISBN:9781119256830Author:Amos GilatPublisher:John Wiley & Sons Inc
 Probability and Statistics for Engineering and th...StatisticsISBN:9781305251809Author:Jay L. DevorePublisher:Cengage Learning
 Statistics for The Behavioral Sciences (MindTap C...StatisticsISBN:9781305504912Author:Frederick J Gravetter, Larry B. WallnauPublisher:Cengage Learning
  Elementary Statistics: Picturing the World (7th E...StatisticsISBN:9780134683416Author:Ron Larson, Betsy FarberPublisher:PEARSON
 The Basic Practice of StatisticsStatisticsISBN:9781319042578Author:David S. Moore, William I. Notz, Michael A. FlignerPublisher:W. H. Freeman
 Introduction to the Practice of StatisticsStatisticsISBN:9781319013387Author:David S. Moore, George P. McCabe, Bruce A. CraigPublisher:W. H. Freeman
MATLAB: An Introduction with Applications
Statistics
ISBN:9781119256830
Author:Amos Gilat
Publisher:John Wiley & Sons Inc
Probability and Statistics for Engineering and th...
Statistics
ISBN:9781305251809
Author:Jay L. Devore
Publisher:Cengage Learning
Statistics for The Behavioral Sciences (MindTap C...
Statistics
ISBN:9781305504912
Author:Frederick J Gravetter, Larry B. Wallnau
Publisher:Cengage Learning
Elementary Statistics: Picturing the World (7th E...
Statistics
ISBN:9780134683416
Author:Ron Larson, Betsy Farber
Publisher:PEARSON
The Basic Practice of Statistics
Statistics
ISBN:9781319042578
Author:David S. Moore, William I. Notz, Michael A. Fligner
Publisher:W. H. Freeman
Introduction to the Practice of Statistics
Statistics
ISBN:9781319013387
Author:David S. Moore, George P. McCabe, Bruce A. Craig
Publisher:W. H. Freeman