MATLAB: An Introduction with Applications
6th Edition
ISBN: 9781119256830
Author: Amos Gilat
Publisher: John Wiley & Sons Inc
expand_more
expand_more
format_list_bulleted
Question

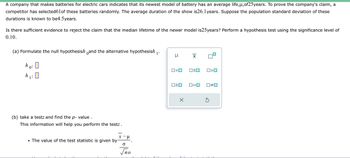
Transcribed Image Text:A company that makes batteries for electric cars indicates that its newest model of battery has an average life,µ,of25years. To prove the company's claim, a
competitor has selected61of these batteries randomly. The average duration of the show is26.1years. Suppose the population standard deviation of these
durations is known to be4.5 years.
Is there sufficient evidence to reject the claim that the median lifetime of the newer model is25years? Perform a hypothesis test using the significance level of
0.10.
(a) Formulate the null hypothesish and the alternative hypothesish 1'
ho:
h₁:0
1:
(b) take a testz and find the p-value.
This information will help you perform the testz.
• The value of the test statistic is given by
#112²
no
μ
O<O
ロミロ
X
X
□≤o
O<O
0=0 ☐#0

Transcribed Image Text:●
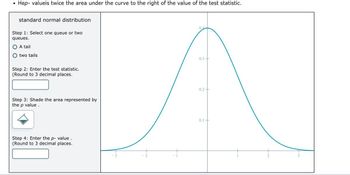
Hep-valueis twice the area under the curve to the right of the value of the test statistic.
standard normal distribution
Step 1: Select one queue or two
queues.
A tail
two tails
Step 2: Enter the test statistic.
(Round to 3 decimal places.
Step 3: Shade the area represented by
the p value.
Step 4: Enter the p- value.
(Round to 3 decimal places.
2
- 1
0.4
0.3
0.2 +
0.1+
ta
2
3
Expert Solution
This question has been solved!
Explore an expertly crafted, step-by-step solution for a thorough understanding of key concepts.
Step by stepSolved in 5 steps with 16 images

Knowledge Booster
Similar questions
- A sample of 10 from population 1 has a mean of 32 and a standard deviation of 6. A sample of 13 from population 2 has a mean of 48 and a standard deviation of 8. The population standard deviations are unknown but assumed to be equal. Test the hypothesis, at the 1% level of significance, that the population means are the same. State your conclusion as a sentence and include the test statistic and the critical value.arrow_forwardAn engineer working for a tire manufacturer investigates the average life of a new material to be used in the manufacturing process. For this purpose, he builds a sample of 13 tires and tests them in a laboratory until the end of their useful life is reached. The data obtained from the sample are as follows: average of 60897.9 km and standard deviation of 2734.8 km. The engineer would like to demonstrate that the average service life of the tire with the new material exceeds 60,000 km. a) State the null and alternative hypothesis to be stated in this experiment. Test the stated hypotheses using an α = 0.05 What conclusions are reached? b) Find a 95% confidence interval for the average tire life with the new material. Interpret your answer. (RESPOND MANUALLY) (RESPOND MANUALLY)arrow_forwardIn the year 2033, Sarai Patterson is a leading traveling nurse. Sarai is interested in reducing the mean recovery time for patients after experiencing a serious injury (assume recovery times are normally distributed). Suppose the mean recovery time is presently 8.6 months. Sarai takes a random sample of 46 patients that have experienced serious injury to participate in a new treatment program and finds the sample mean is 8.1 months and a sample standard deviation of 1.2 months. Using α = 0.05, answer the following questions. a) What is the setup for your null and alternative hypothesis? b) What is the value of the test statistic? c) What is/are the critical value(s)?arrow_forward
- Currently patrons at the library speak at an average of 61 decibels. Will this average increase after the installation of a new computer plug in station? After the plug in station was built, the librarian randomly recorded 57 people speaking at the library. Their average decibel level was 63.8 and their standard deviation was 9. What can be concluded at the the αα = 0.10 level of significance?arrow_forwardA manufacturer claims that the mean lifetime, u, of its light bulbs is 44 months. The standard deviation of these lifetimes is 7 months. Twenty-three bulbs are selected at random, and their mean lifetime is found to be 48 months. Assume that the population is normally distributed. Can we conclude, at the 0.01 level of significance, that the mean lifetime of light bulbs made by this manufacturer differs from 44 months? Perform a two-tailed test. Then complete the parts below. Carry your intermediate computations to three or more decimal places, and round your responses as specified below. (If necessary, consult a list of formulas.) (a) State the null hypothesis H, and the alternative hypothesis H,. p H, :0 H, :0 (b) Determine the type of test statistic to use. (Choose one) v O=0 OSO |(c) Find the value of the test statistic. (Round to three or more decimal places.) Oarrow_forwardA manufacturer claims that the mean lifetime, u, of its light bulbs is 42 months. The standard deviation of these lifetimes is 6 months. Twenty-seven bulbs are selected at random, and their mean lifetime is found to be 41 months. Assume that the population is normally distributed. Can we conclude, at the 0.01 level of significance, that the mean lifetime of light bulbs made by this manufacturer differs from 42 months? Perform a two-tailed test. Then complete the parts below. Carry your intermediate computations to three or more decimal places, and round your responses as specified below. (If necessary, consult a list of formulas.) (a) State the null hypothesis H, and the alternative hypothesis H1. p H, :0 H, :0 (b) Determine the type of test statistic to use. D=D OSO (Choose one) (c) Find the value of the test statistic. (Round to three or more decimal places.) (d) Find the two critical values. (Round to three or more decimal places.) Dand (e) Can we conclude that the mean lifetime of…arrow_forwardThe manufacturer of Suzanne Space Saver tables finds that the mean time needed by online buyers to assemble the tables is 1 hour with a standard deviation of 0.25 hours. The design team of the firm has developed a new manual to reduce the time needed to assemble the table by its buyers. To test the effectiveness of the new manual, the team selects and gives 20 buyers the new manual to use. The sampled buyers take a mean of 0.45 hours to assemble each table. Assuming that the population is normally distributed, and using the 0.05 level of significance, determine and interpret the p value for the test and state whether we should conclude that the new manual is effective.arrow_forwardA large manufacturing plant uses lightbulbs with lifetimes that are normally distributed with a mean of 1500 hours and a standard deviation of 80 hours. To minimize the number of bulbs that burn out during operating hours, all bulbs are replaced at once. How often should the bulbs be replaced so that only 1% burn out between replacement periods? (Round your answer to one decimal place.)arrow_forwardA manufacturer claims that the mean lifetime, μ , of its light bulbs is 55 months. The standard deviation of these lifetimes is 6 months. Forty-two bulbs are selected at random, and their mean lifetime is found to be 58 months. Assume that the population is normally distributed. Can we conclude, at the 0.05 level of significance, that the mean lifetime of light bulbs made by this manufacturer differs from 55 months? Perform a two-tailed test. Then fill in the table below. Carry your intermediate computations to at least three decimal places, and round your responses as specified in the table. The null hypothesis: H0: The alternative hypothesis: H1: The type of test statistic: (Choose one)ZtChi squareF The value of the test statistic:(Round to at least three decimal places.) The two critical values at the 0.05 level of significance:(Round to at least three decimal places.) and Can we…arrow_forwardarrow_back_iosarrow_forward_ios
Recommended textbooks for you
 MATLAB: An Introduction with ApplicationsStatisticsISBN:9781119256830Author:Amos GilatPublisher:John Wiley & Sons Inc
 Probability and Statistics for Engineering and th...StatisticsISBN:9781305251809Author:Jay L. DevorePublisher:Cengage Learning
 Statistics for The Behavioral Sciences (MindTap C...StatisticsISBN:9781305504912Author:Frederick J Gravetter, Larry B. WallnauPublisher:Cengage Learning
 Elementary Statistics: Picturing the World (7th E...StatisticsISBN:9780134683416Author:Ron Larson, Betsy FarberPublisher:PEARSON
 The Basic Practice of StatisticsStatisticsISBN:9781319042578Author:David S. Moore, William I. Notz, Michael A. FlignerPublisher:W. H. Freeman
 Introduction to the Practice of StatisticsStatisticsISBN:9781319013387Author:David S. Moore, George P. McCabe, Bruce A. CraigPublisher:W. H. Freeman

MATLAB: An Introduction with Applications
Statistics
ISBN:9781119256830
Author:Amos Gilat
Publisher:John Wiley & Sons Inc

Probability and Statistics for Engineering and th...
Statistics
ISBN:9781305251809
Author:Jay L. Devore
Publisher:Cengage Learning

Statistics for The Behavioral Sciences (MindTap C...
Statistics
ISBN:9781305504912
Author:Frederick J Gravetter, Larry B. Wallnau
Publisher:Cengage Learning

Elementary Statistics: Picturing the World (7th E...
Statistics
ISBN:9780134683416
Author:Ron Larson, Betsy Farber
Publisher:PEARSON

The Basic Practice of Statistics
Statistics
ISBN:9781319042578
Author:David S. Moore, William I. Notz, Michael A. Fligner
Publisher:W. H. Freeman

Introduction to the Practice of Statistics
Statistics
ISBN:9781319013387
Author:David S. Moore, George P. McCabe, Bruce A. Craig
Publisher:W. H. Freeman