MATLAB: An Introduction with Applications
6th Edition
ISBN: 9781119256830
Author: Amos Gilat
Publisher: John Wiley & Sons Inc
expand_more
expand_more
format_list_bulleted
Question

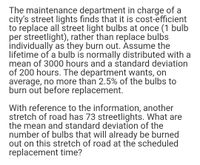
Transcribed Image Text:The maintenance department in charge of a
city's street lights finds that it is cost-efficient
to replace all street light bulbs at once (1 bulb
per streetlight), rather than replace bulbs
individually as they burn out. Assume the
lifetime of a bulb is normally distributed with a
mean of 3000 hours and a standard deviation
of 200 hours. The department wants, on
average, no more than 2.5% of the bulbs to
burn out before replacement.
With reference to the information, another
stretch of road has 73 streetlights. What are
the mean and standard deviation of the
number of bulbs that will already be burned
out on this stretch of road at the scheduled
replacement time?
Expert Solution
This question has been solved!
Explore an expertly crafted, step-by-step solution for a thorough understanding of key concepts.
Step by stepSolved in 2 steps with 2 images

Knowledge Booster
Similar questions
- What percent of the students received a score below 64, if the mean grade on a test was 70 and the standard deviation was 6. For the same test results as prob 1), what percent of studen ts scored between 64 and 80 .arrow_forwardThe first exam for a Stats course had a mean of 80 and a standard deviation of 4 points; the second had a mean of 70 and a standard deviation of 15 points. Reginald scored an 80 on the first test and an 85 on the second. Sara scored an 88 on the first but only a 65 on the second. Although Reginald's total score is higher, Sara feels she should get the higher grade. Explain her point of view.arrow_forwardThe average age of senators in the 108th Congress was 62 years. If the standard deviation was 12.5 years, find the z-scores corresponding to the oldest and youngest senators of age 86 and 46. Round z scores to two decimal places.arrow_forward
- A California lake has been stocked with rainbow trout. These trout have an average length of 24 inches, with a standard deviation of 3 inches. Someone goes fishing and catches a trout that is 26.25 inches long. Express the length of this trout in standard units, relative to all the trout that were used to stock the lake. Choose the answer below that is closest.arrow_forwardIf we collected data on how many pets each person in our class has, describe a situation that the standard deviation would be 0. Jo thinks that the only way for this to happen is for everyone to have no pets. Explain to Jo why the answer they have is correct, but not the only way.arrow_forwardPlease show steps and answer all questions.arrow_forward
- The Michelin tires in average will last for 60000 miles. A technician claims that the deviation of mileage for wearied off tires is 25000 miles. If 16 such tires are tested, find the probability that for those tires the average wearied off mileage is between 55000 and 65000 miles.arrow_forwardsuppose that a category of world-class runners are known to run a marathon (26 miles) in an average of 143 minutes with a standard deviation of 14 minutes. consider 49 of the races. Let x̅ = the average of the 49 races. I need help finding the median of the average running times. if someone could explain how to solve this problem that would be greatarrow_forwardAssume that we have made 10 repeated measurements of a quantity, and as a result the error assigned to the “best estimate” of the mean is 6. If we then expand our data set to a total of 20 measurements, the error in the mean will reduce to just 3. True or Falsearrow_forward
- Assume that the readings on the thermometers are normally distributed with a mean of 0° and standard deviation of 1.00°C. A thermometer is randomly selected and tested. Draw a sketch and find the temperature reading corresponding to P89, the 89th percentile. This is the temperature reading separating the bottom 89% from the top 11%. Click to view page 1 of the table. Click to view_page 2 of the table. Which graph represents P89" ? Choose the correct graph below. A. В. D. The temperature for P89 is approximately. (Round to two decimal places as needed.)arrow_forwardPlease typearrow_forward
arrow_back_ios
arrow_forward_ios
Recommended textbooks for you
 MATLAB: An Introduction with ApplicationsStatisticsISBN:9781119256830Author:Amos GilatPublisher:John Wiley & Sons Inc
 Probability and Statistics for Engineering and th...StatisticsISBN:9781305251809Author:Jay L. DevorePublisher:Cengage Learning
 Statistics for The Behavioral Sciences (MindTap C...StatisticsISBN:9781305504912Author:Frederick J Gravetter, Larry B. WallnauPublisher:Cengage Learning
 Elementary Statistics: Picturing the World (7th E...StatisticsISBN:9780134683416Author:Ron Larson, Betsy FarberPublisher:PEARSON
 The Basic Practice of StatisticsStatisticsISBN:9781319042578Author:David S. Moore, William I. Notz, Michael A. FlignerPublisher:W. H. Freeman
 Introduction to the Practice of StatisticsStatisticsISBN:9781319013387Author:David S. Moore, George P. McCabe, Bruce A. CraigPublisher:W. H. Freeman

MATLAB: An Introduction with Applications
Statistics
ISBN:9781119256830
Author:Amos Gilat
Publisher:John Wiley & Sons Inc

Probability and Statistics for Engineering and th...
Statistics
ISBN:9781305251809
Author:Jay L. Devore
Publisher:Cengage Learning

Statistics for The Behavioral Sciences (MindTap C...
Statistics
ISBN:9781305504912
Author:Frederick J Gravetter, Larry B. Wallnau
Publisher:Cengage Learning

Elementary Statistics: Picturing the World (7th E...
Statistics
ISBN:9780134683416
Author:Ron Larson, Betsy Farber
Publisher:PEARSON

The Basic Practice of Statistics
Statistics
ISBN:9781319042578
Author:David S. Moore, William I. Notz, Michael A. Fligner
Publisher:W. H. Freeman

Introduction to the Practice of Statistics
Statistics
ISBN:9781319013387
Author:David S. Moore, George P. McCabe, Bruce A. Craig
Publisher:W. H. Freeman