
Related questions

- Given Information :
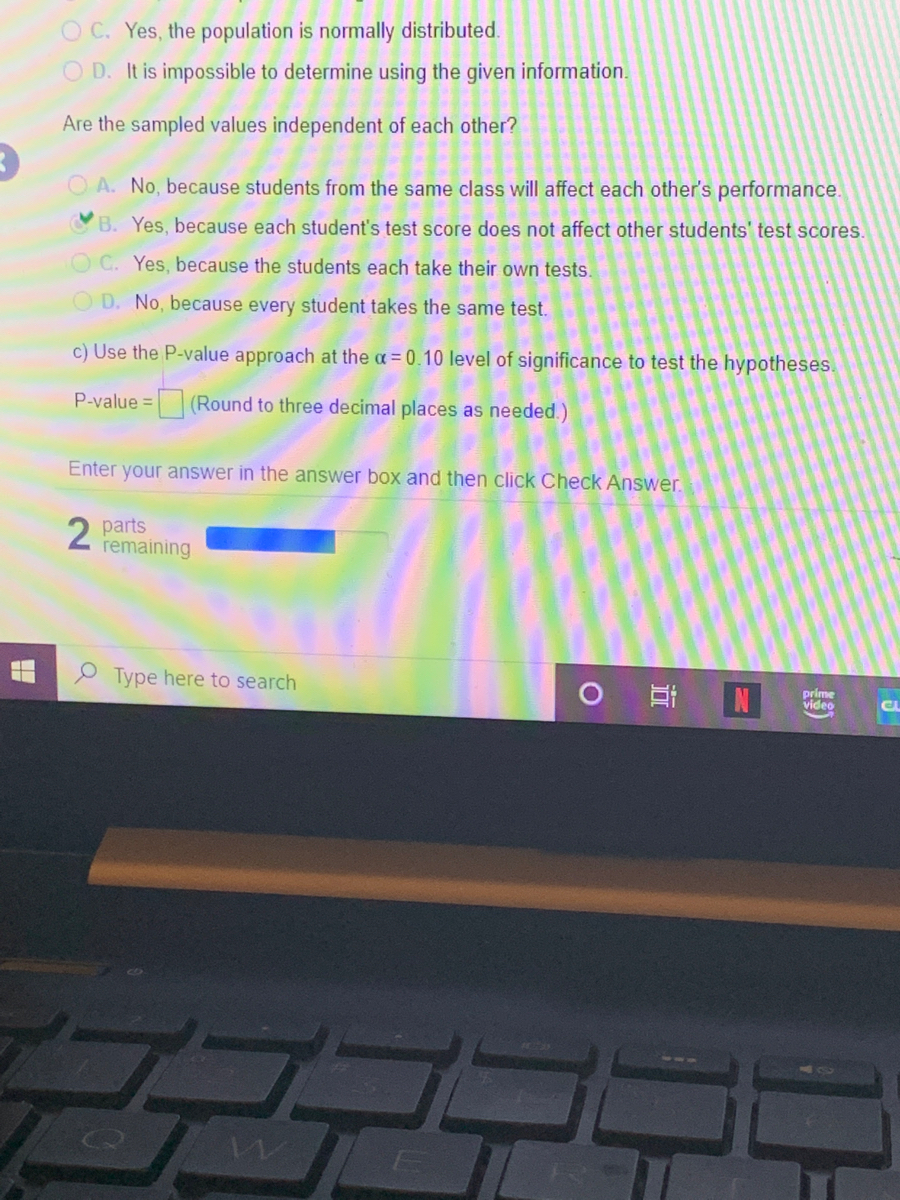
A college entrance exam company determined that a score of 20 on the mathematics portion of the exam suggests that a student is ready for college-level mathematics. To achieve this goal, the company recommends that students take a core curriculum of math courses in high school. Suppose a random sample of 250 students who completed this core set of courses results in a mean math score of 20.5 on the college entrance exam with a standard deviation of 3.3.
Null and Alternative Hypotheses
The following null and alternative hypotheses need to be tested:
Ho: Average score on the mathematics portion of the exam is equal to 20 .
=
Ha: Average score on the mathematics portion of the exam is above 20 .
>
This corresponds to a right-tailed test, for which a t-test for one mean, with unknown population standard deviation will be used.
For a t-test for one mean, the sampling distribution used for the t-test statistic (which is the distribution of the test statistic under the assumption that the null hypothesis is true) corresponds to the t-distribution, with n-1 degrees of freedom

Trending nowThis is a popular solution!

Step by stepSolved in 2 steps with 1 images


- Salvatore, as the director of a regional bank, is concerned about the wait times of customers at the four branches. He randomly selects 48 patrons at each branch and records the waiting time for each patron. The results of the samples are shown below. The Alvrine branch has a mean waiting time of 13.49 minutes with a standard deviation of 1.97 minutes.The Durham branch has a mean waiting time of 12.61 minutes with a standard deviation of 2.89 minutes.The Hanover branch has a mean waiting time of 11.06 minutes with a standard deviation of 2.46 minutes.The Mascomonet branch has a mean waiting time of 12.89 minutes with a standard deviation of 3.12 minutes.arrow_forwardA researcher collected data from Boston police officers and found that on average they spent 14.3 hours on in-service training per year with a standard deviation of 3.2. The department offers bonuses for officers in the top 10 percent on in-service training completed. Would the officer who did 22 hours of training get the bonus?arrow_forwardA marketing researcher wants to estimate the mean amount spent per year ($) on a web site by membership member shoppers. Suppose a random sample of 100 membership member shoppers who recently made a purchase on the web site yielded a mean amount spent of $55 and a standard deviation of $52. Complete parts (a) and (b) below. a. Is there evidence that the population mean amount spent per year on the web site by membership member shoppers is different from $51? (Use a 0.01 level of significance.) State the null and alternative hypotheses. Ho: H (Type integers or decimals. Do not round. Do not include the $ symbol in your answer.) Identify the critical value(s). The critical value(s) is/are (Type an integer or a decimal. Round to two decimal places as needed. Use a comma to separate answers as needed.) Determine the test statistic. The test statistic, 1STAT, is (Type an integer or a decimal. Round to two decimal places as needed.) State the conclusion. Ho. There is evidence that the…arrow_forward
- A company conducted a survey on the number of hours employees spend on a particular task per week. The data collected from a sample of 10 employees are as follows: 5, 6, 7, 8, 9, 10, 10, 11, 12, 13. Calculate the standard deviation of the hours spent on the task per week.arrow_forwardOn the PSAT test taken by about 1.5 million high school juniors each year, the mean score on the reading portion of the test was 46.9, with a standard deviation of 10.9. The scores are normally distributed. If a student needed a score on this portion of the test that put them in the top 5% of scores nationally to qualify for a particular scholarship, what is the minimum score they must achieve?arrow_forwardFran is training for her first marathon, and she wants to know if there is a significant difference between the mean number of miles run each week by group runners and individual runners who are training for marathons. She interviews 42 randomly selected people who train in groups and finds that they run a mean of 47.1 miles per week. Assume that the population standard deviation for group runners is known to be 4.4 miles per week. She also interviews a random sample of 47 people who train on their own and finds that they run a mean of 48.5 miles per week. Assume that the population standard deviation for people who run by themselves is 1.8 miles per week. Test the claim at the 0.01 level of significance. Let group runners training for marathons be Population 1 and let individual runners training for marathons be Population 2. Step 2 of 3 : Compute the value of the test statistic. Round your answer to two decimal places.arrow_forward
- 10arrow_forwardIn a sample of 351 gamers between the ages of 16-25, the mean number of hours spent gaming per week was 42.5 hours. In a sample of 269 gamers between the ages of 26-40, the mean number of hours spent gaming per week was 43.8 hours. If the population standard deviation for the mean number of hours spent gaming per week is 9.5 for the age group 16-25 and 10.7 for the age group 26-40, test the claim that gamers between the ages of 16-25 spend less time gaming per week than gamers between the ages of 26-40. Assume α=0.03. Let population 1 be gamers in the age group 16-25 and population 2 be gamers in the age group 26-40. Round the test statistic to two decimal places, and round the p-value to four decimal places. The test statistic is . The p-value is . Should the null hypothesis be rejected?arrow_forwardThe combined SAT scores for the students at a local high school are normally distributed with a mean of 1478 and a standard deviation of 292. The local college includes a minimum score of 689.6 in its admission requirements.What percentage of students from this school earn scores that satisfy the admission requirement?arrow_forward
- MATLAB: An Introduction with ApplicationsStatisticsISBN:9781119256830Author:Amos GilatPublisher:John Wiley & Sons Inc
 Probability and Statistics for Engineering and th...StatisticsISBN:9781305251809Author:Jay L. DevorePublisher:Cengage Learning
 Statistics for The Behavioral Sciences (MindTap C...StatisticsISBN:9781305504912Author:Frederick J Gravetter, Larry B. WallnauPublisher:Cengage Learning
  Elementary Statistics: Picturing the World (7th E...StatisticsISBN:9780134683416Author:Ron Larson, Betsy FarberPublisher:PEARSON
 The Basic Practice of StatisticsStatisticsISBN:9781319042578Author:David S. Moore, William I. Notz, Michael A. FlignerPublisher:W. H. Freeman
 Introduction to the Practice of StatisticsStatisticsISBN:9781319013387Author:David S. Moore, George P. McCabe, Bruce A. CraigPublisher:W. H. Freeman